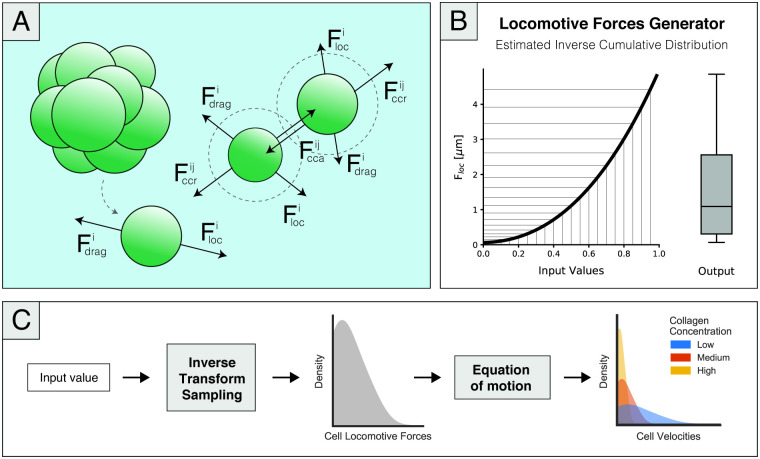
Fig 2.
(A)A simplified representation of the force diagram showing the cell-cell and cell-matrix interactions present in the model, as described by Eq 2. The model considers cell-generated locomotive forces, drag forces imposed by the ECM, and cell-cell adhesion and repulsion of cells that are inside an interaction radius. Although the model only accounts for the cell volume and not cell geometry, spherical geometry is assumed. (B) Representation of the locomotive forces generator function modelled as 5 through an estimation of the inverse cumulative distribution of experimental cell velocities. When fed uniformly distributed random values between 0 and 1, the represented function produced a new set of values that followed the desired force distribution, as shown by the representative boxplot showcased as the output of this function. (C) Schematic representation of the implemented workflow to model cell-generated locomotive forces (considering no cell-cell interactions). At an average of 20 simulated minutes, cells are allowed to change their velocity both in magnitude and direction. Accordingly, at those time points, we generated a new cell-generated force value through the inverse sampling method. The output of this function was subsequently incorporated into the equation of motion, given by Eq 4, producing three different velocity distributions, each corresponding to a matrix density value.

