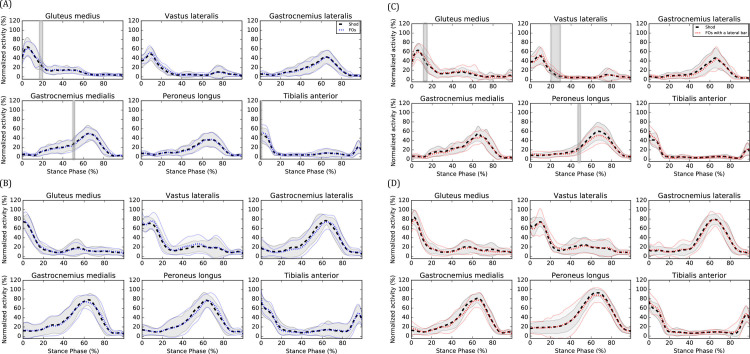
Fig 3.
EMG effects of (A) FOs at CW, (B) FOs at FW, (C) FOs with a lateral bar at CW and (D) FOs with a lateral bar at FW. Means of the shod (black), FOs (blue) and FOs with a lateral bar (red) are represented by dotted lines and standard deviations are observed between the full lines. Significant between-group differences are observed in the shaded region.

