
Figure 3. Pro-ictal states.
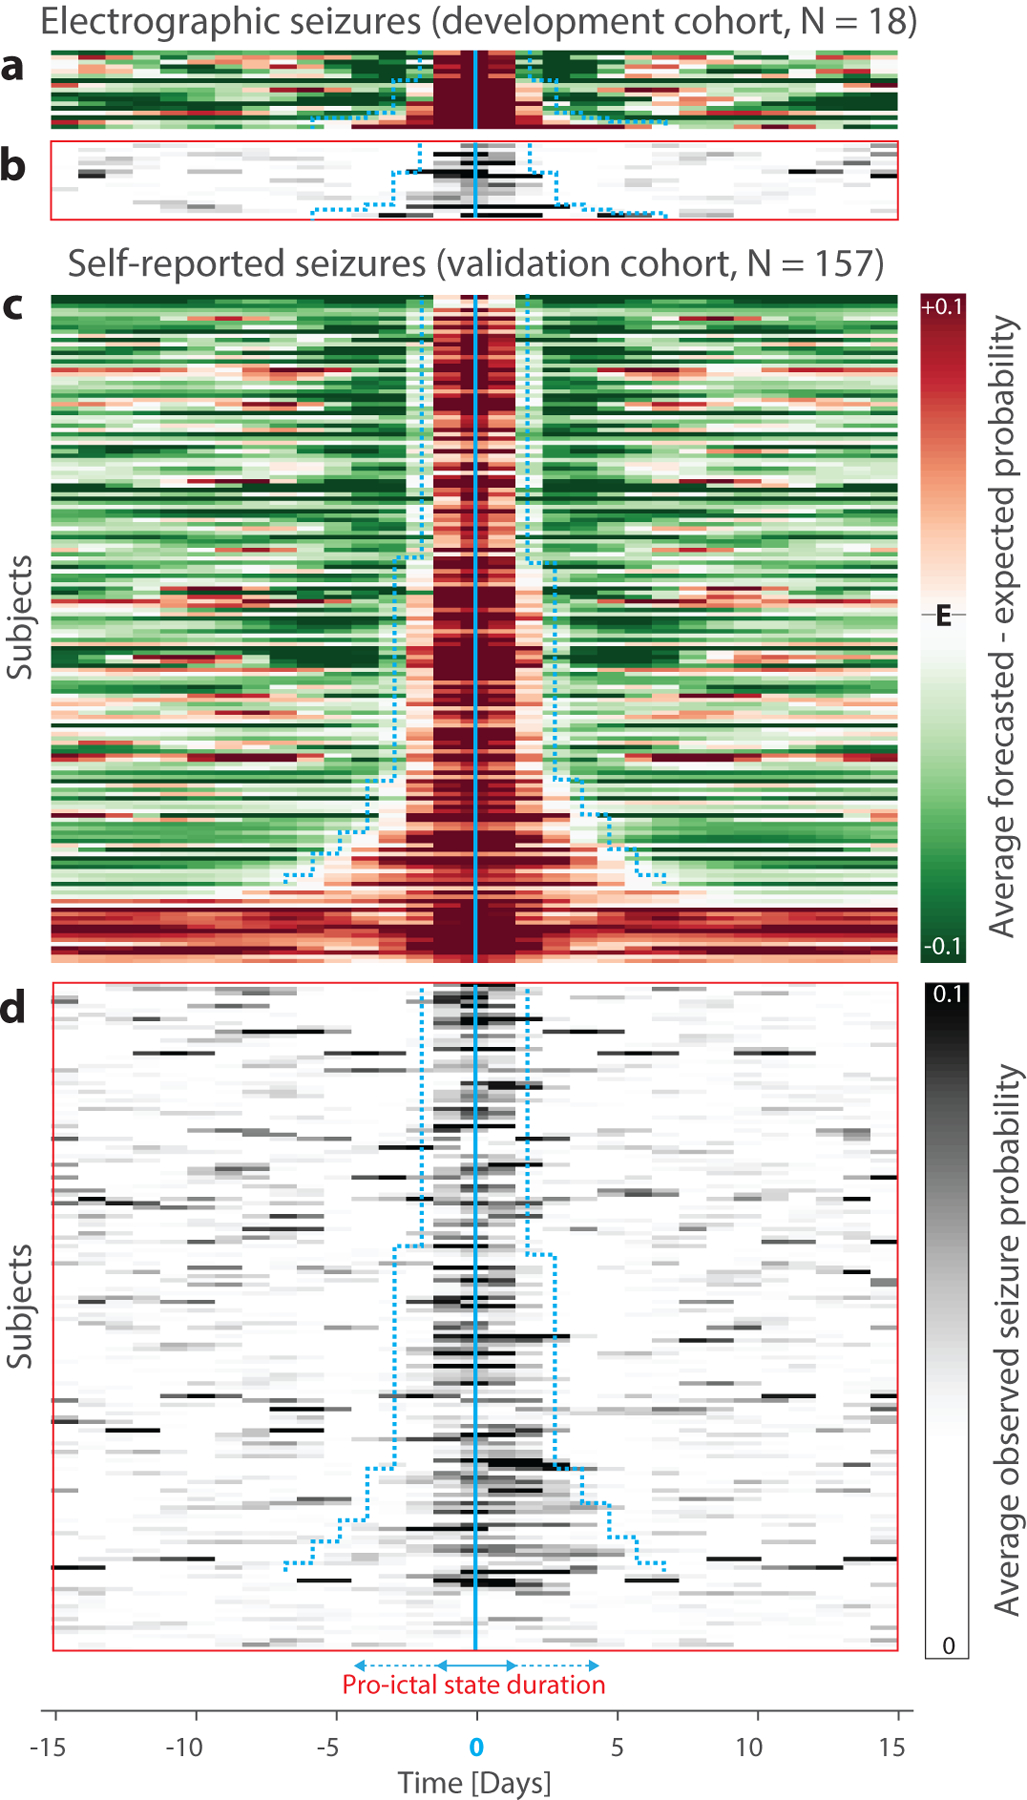
(a) Peak-aligned normalized average forecast probabilities for all subjects in the electrographic seizures (development) cohort (N=18, rows, ranked by width of pro-ictal state) reveal days-long periods of seizure probability higher than the expected seizure probability (E). (b) Distributions of observed seizure probabilities averaged in the same way align well with periods of high risk. (c) and (d) show data analogous to (a) and (b) from the self-reported seizures (validation) cohort (N=157). Cyan boundaries depict estimated durations of pro-ictal states, which range from three to five days in the majority of subjects and more than seven days in a minority of subjects. Most subjects whose forecasts did not show IoC reside at the bottom, outside of the cyan boundaries.