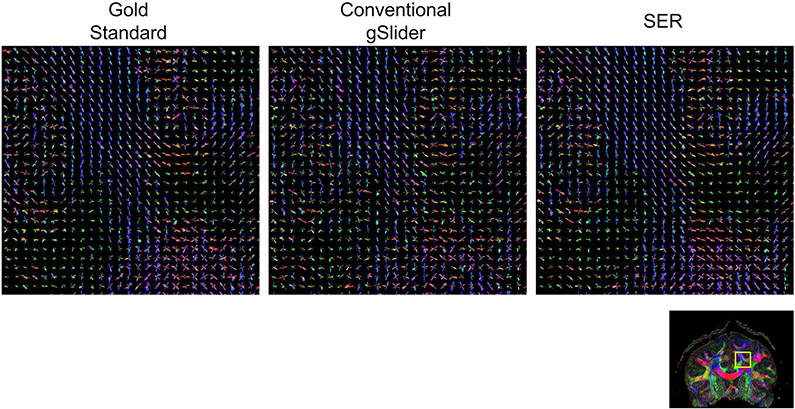
FIGURE 7.
ODFs estimated using the FRACT from gold standard, conventional gSlider, and SER images. ODFs are shown from the brain region indicated by the yellow box in the reference color FA image. We have chosen to show a relatively large ROI to make it easier to visualize the higher level white-matter connectivity patterns that are present in the data. In addition, a higher resolution version of this figure is provided in Supporting Information Figure S3 for readers interested in the details of individual ODFs

