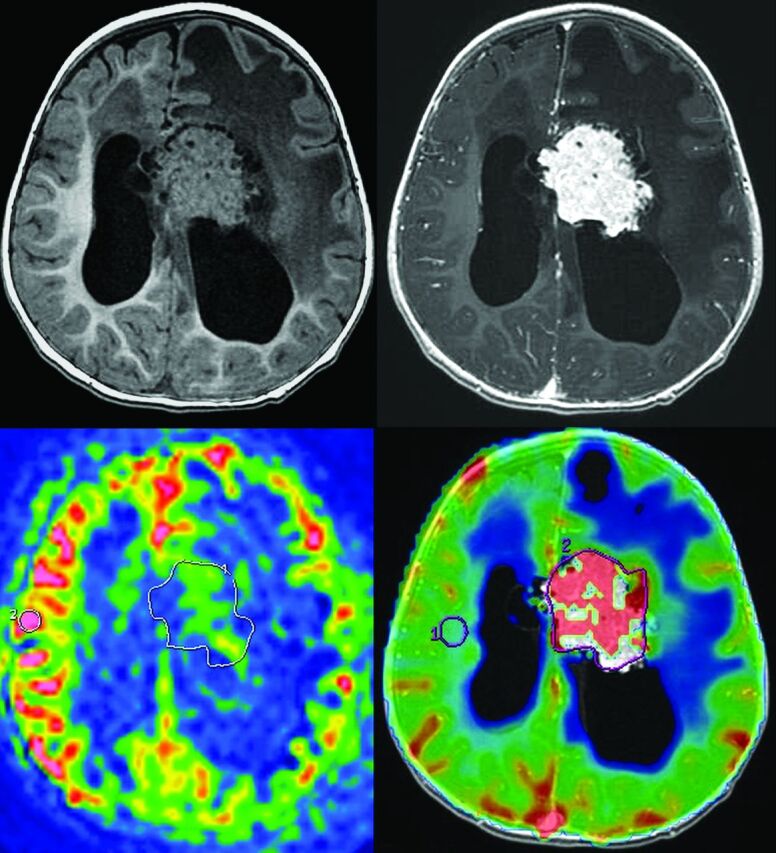
Fig 2.

Measurement of ASL and DSC-PWI of a choroid plexus papilloma (patient 1). Top left: 3D T1-weighted MR imaging. Top right: 3D T1-weighted MR imaging with gadolinium injection. Bottom left: arterial spin-labeling. ROIs are drawn around the whole tumor and in the contralateral gray matter. Bottom right: dynamic susceptibility contrast perfusion-weighted imaging. ROIs are drawn around the whole tumor and in the contralateral white matter.
