
Fig 2.

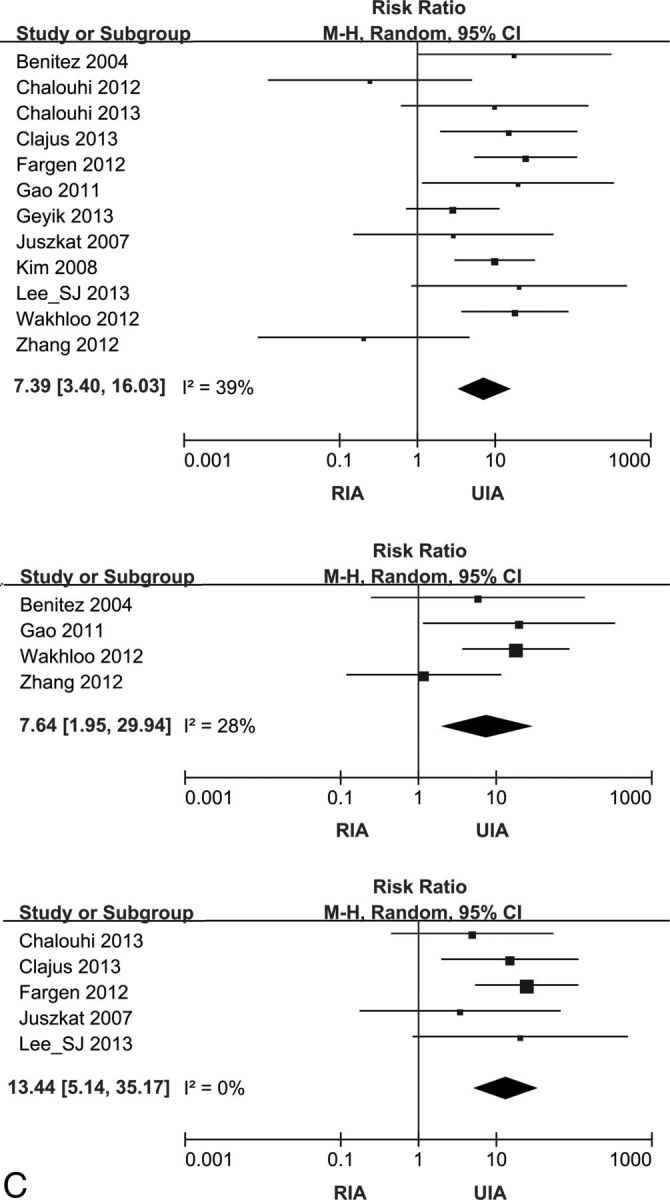
Forest plots showing the risk ratio for complications and the mortality of stent-assisted coiling comparing RIA and UIA. Effect sizes are plotted with 95% CIs. A, Forest plots for TEC. From uppermost to lowest, plots for the pooled studies and preprocedural, postprocedural, and modified antiplatelet subgroups. B, Forest plots for intraprocedural hemorrhage. The upper plot is for pooled studies, and lower one is for the postprocedural antiplatelet subgroup. C (next page), Forest plots for mortality. Starting with the uppermost, plots for the pooled studies and pre- and postprocedural antiplatelet subgroups.