Fig 2.

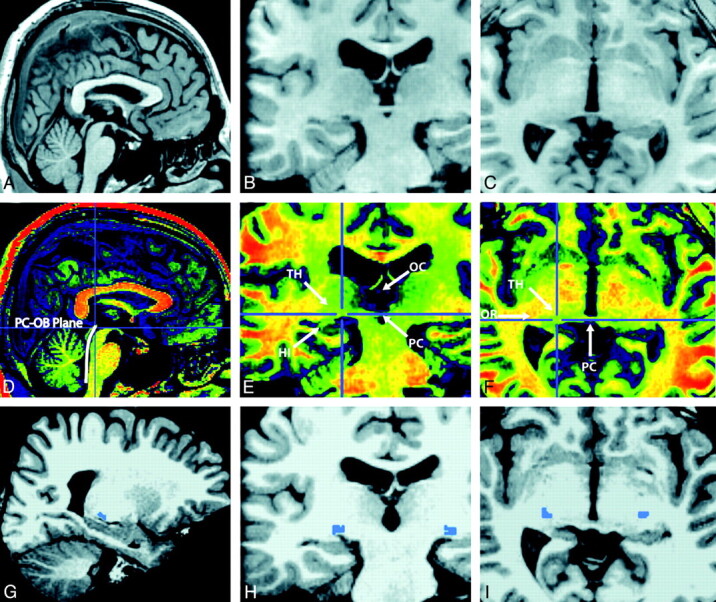
Delineation of the LGN on cross-sectional images. A–F, The images show the cerebral cortex in gray levels (A–C) and pseudocolor enhancement images (D–F). G–I, The cross-sectional images of candidate LGN maps are shown in blue.

Delineation of the LGN on cross-sectional images. A–F, The images show the cerebral cortex in gray levels (A–C) and pseudocolor enhancement images (D–F). G–I, The cross-sectional images of candidate LGN maps are shown in blue.