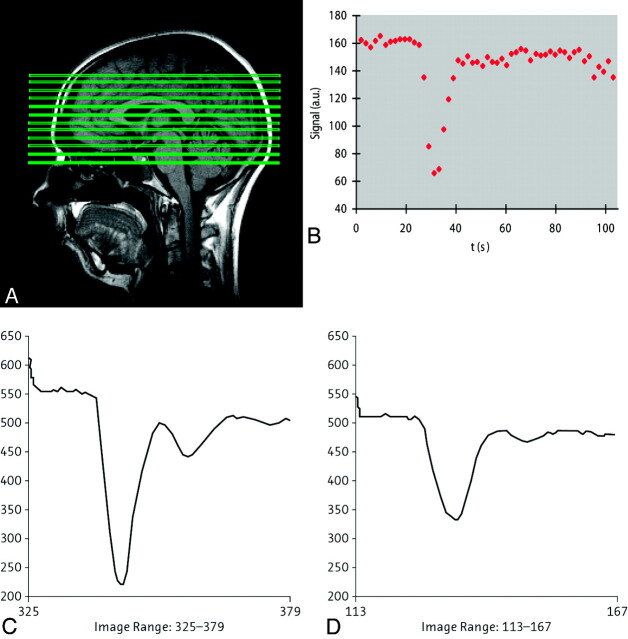
Fig 11.
A, Sagittal scout MR image with the position of the sections in which perfusion information is acquired. B, Signal intensity–time curve from DSC MR imaging after a bolus injection of a single dose of contrast agent, with substantial signal intensity drop due to the susceptibility effect of the contrast medium. C and D, Signal intensity–time curves from different contrast medium concentrations at a triple dose: 28 mL of the 1.0 mol/L gadobutrol formulation (C) and 56 mL of a 0.5 mol/L gadobutrol formulation (D) in the putamen of the same subject. The susceptibility effect is significantly stronger by using a higher concentration of contrast medium. C and D, reprinted with permission from Radiology (2003;226:880–88). Copyright 2003, Radiological Society of North America.

