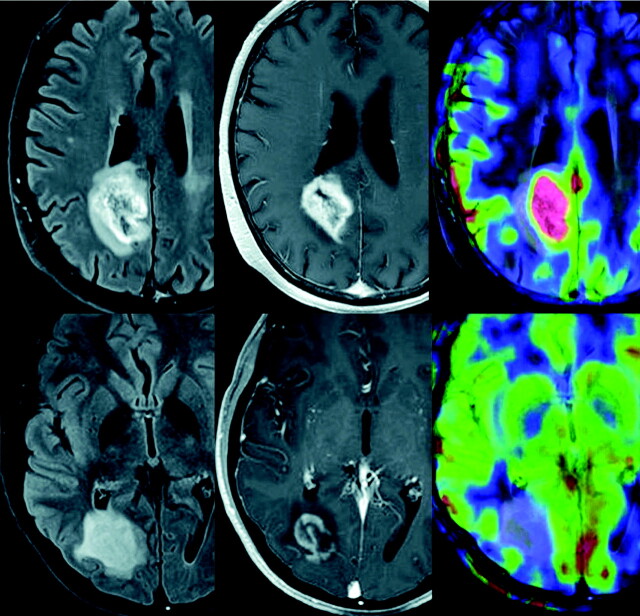
Fig 3.
MR imaging (FLAIR, contrast-enhanced T1-weighted, and cerebral blood flow maps acquired with arterial spin-labeling) obtained in patients with a high-grade necrotic glioma (upper row) and an acute inflammatory-demyelinating lesion (lower row). Observe how, despite similar lesion patterns on both T2- and contrast-enhanced T1-weighted sequences, only the high-grade glioma shows a clear increase in cerebral blood flow.

