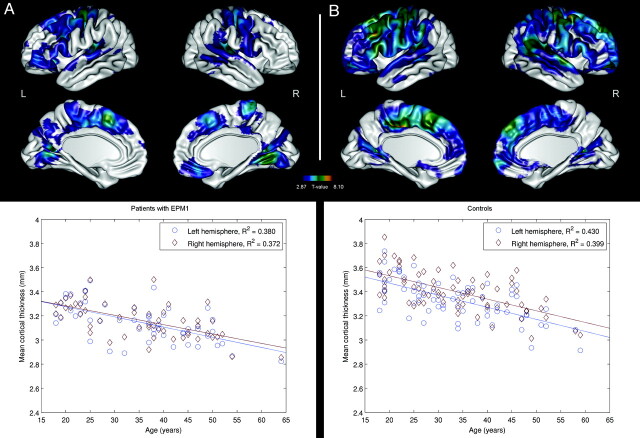
Fig 2.
Brain regions with significant (P < .01, FDR-corrected) negative correlations between age and CTH in patients with EPM1 (A) and controls (B). Scatterplots indicate correlations between age and mean CTH in individual subjects. The individual mean thicknesses have been calculated on the basis of the regions surviving the statistical threshold.

