
Fig. 2. Gene expression of promyogenic line diverges from the blunted lines.
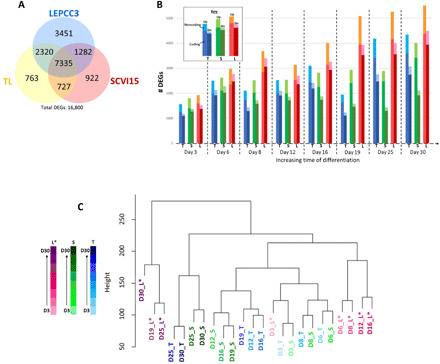
(A) Venn diagram summarizes overlap in number of differentially expressed genes (DEGs) across all time points in the three cell lines (TL, yellow; SCVI15, red; or LEPCC3, blue), with total number of DEGs listed below. (B) Graph shows number of DEGs (y axis) with respect to time (x axis) and cell line (TL, blue; SCVI, green; LEPCC3, red). Each pair of bars represents up-regulated transcripts on the left and down-regulated transcripts on the right. The top-most section of each bar represents the number of noncoding up-regulated (Up) and down-regulated (Dn) transcripts. (C) Hierarchical clustering with respect to DEGs of all time points from all cell lines [LEPCC3 (L*), magenta; SCVI15 (S), green; TL (T), blue]. Darker color represents increasing time of differentiation. Asterisk marks the promyogenic line.