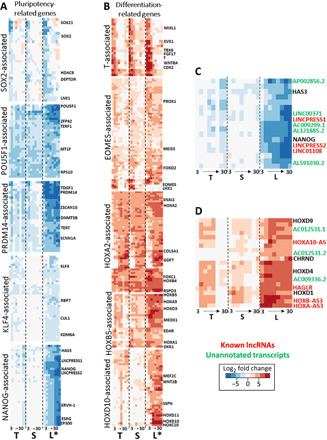
Fig. 3. Cell line–dependent gene expression regulates pluripotency and initial lineage commitment.

(A) Heatmaps with expression patterns of gene modules associated with regulators of pluripotency: SOX2, POU5F1, PRDM14, KLF4, and NANOG. The modules are determined with dynamic tree cutting of hierarchical clusters with respect to gene expression across all time points and cell lines. Each column of the heatmap represents a cell line, from left to right: T, TL; S, SCVI15; L, LEPCC3 (asterisk marks promyogenic line L*). Within each of the three columns, eight boxes represent time point days 3 to 30. Heatmap colors: Blue represents down-regulated and red represents up-regulated L2FC gene expression with respect to each cell line’s respective day 0 undifferentiated value. (B) Heatmaps with expression patterns of gene modules associated with key regulators of differentiation: T and EOMES are crucial regulators of mesendoderm specification, while HOXA2, HOXB5, and HOXD10 are representative of anterior to posterior HOX family genes. (C) Heatmap detailing the noncoding RNA (ncRNA) transcripts that cluster near NANOG: red, known lncRNAs; green, unannotated transcripts. (D) Heatmap detailing the noncoding ncRNA transcripts that cluster near HOXD9: red, known lncRNAs; green, unannotated transcripts.
