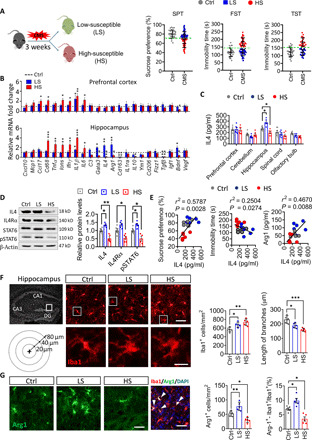
Fig. 1. Hippocampal IL4 levels and Arg1+ microglia are involved in resistance of mice to stress.

(A) Behavioral screening of LS and HS subpopulations of mice exposed to 3-week CMS. (B) Quantitative PCR to examine mRNA expression of cytokines, chemokines, growth factors, and trophic factors in the hippocampus and prefrontal cortex of HS and LS mice. Data are standardized to control group (n = 4 to 6, each sample in triplicate). (C) Enzyme-linked immunosorbent assay to assay the protein level of IL4 in prefrontal cortex, cerebellum, hippocampus, amygdala, and olfactory bulb of control, HS, and LS mice. Each circle represents one mouse (n = 6, each sample in triplicate). (D) Western blotting shows the levels of IL4, IL4 receptor α chain (IL4Rα), STAT6, and pSTAT6 in the hippocampus of control, HS, and LS mice. IL4 and IL4Rα are normalized to β-actin, and the pSTAT6 is normalized to STAT6. (n = 4 to 6, each sample in triplicate). (E) Correlation between sucrose preference or immobility duration in TST, hippocampal Arg1 levels, and hippocampal IL4 levels in CMS-exposed mice. Each circle represents one mouse (n = 6). (F) Morphological characters of hippocampal microglia in control, HS, and LS mice. Scale bars, 50 μm (top) and 10 μm (bottom). The histogram represents the quantification of number and branch length of Iba1+ cells in hippocampus. Each dot in the bar graph represents the average of all micrograph (five to six micrographs for each mouse) in each mouse (n = 5). (G) Immunofluorescence micrographs and quantification of Arg1+ microglia in hippocampus of control, LS, and HS mice (n = 5). Scale bars, 50 μm. Data are presented as means ± SEM. *P < 0.05, **P < 0.01, ***P < 0.005, one-way ANOVA with Tukey test (B, C, D, F, and G). DAPI, 4′,6-diamidino-2-phenylindole.
