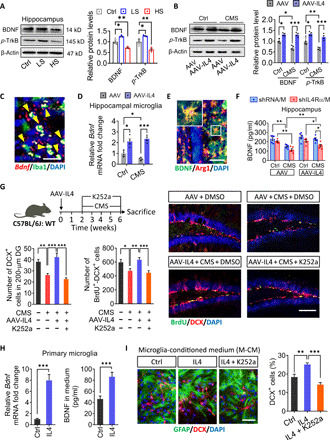
Fig. 5. IL4-driven microglia modulate adult hippocampal neurogenesis in a BDNF-dependent manner.

(A) Western blotting shows the levels of BDNF and TrkB in the hippocampus of LS and HS mice. BDNF and TrkB are normalized to β-actin (n = 3). (B) Western blotting shows the levels of BDNF and TrkB in the hippocampus of CMS and/or AAV-IL4–treated mice. BDNF and TrkB are normalized to β-actin (n = 4). (C) BDNF was detected in hippocampal microglia (Iba1+ cells) using Bdnf-RNAscope. (D) The mRNA expression of BDNF was observed in hippocampal microglia of AAV-IL4–treated mice (n = 4). (E) Double immunohistochemical staining of BDNF and Arg1 in the hippocampus of AAV-IL4 mice. Scale bar, 20 μm. (F) Effects of CMS, knockdown of microglial IL4Rα, and overexpression of IL4 on BDNF protein levels in the hippocampus (n = 5). (G) Effects of k252a treatment to block the BDNF/TrkB pathway on hippocampal neurogenesis in AAV-IL4 mice under CMS exposure. Representative fluorescence micrographs showing DCX expression and BrdU incorporation in the SGZ. Scale bar, 100 μm. Quantification of the number of DCX+ cells and total number of DCX+-BrdU+ cells in the neurogenic zones (n = 5). DMSO, dimethyl sulfoxide. (H) The expression and secretion of BDNF in primary microglia after IL4 treatment in vitro (n = 6). (I) Effects of anti-BDNF antibody or K252a on NSPC proliferation (BrdU+ cells) in the presence of the conditioned culture medium from IL4-treated microglia (n = 5). Scale bar, 20 μm. Data are presented as means ± SEM. *P < 0.05, **P < 0.01, ***P < 0.005, one-way ANOVA with Tukey test (A, G, and I), two-way ANOVA with Tukey test (B, D, and F), and two-tailed t test (H).
