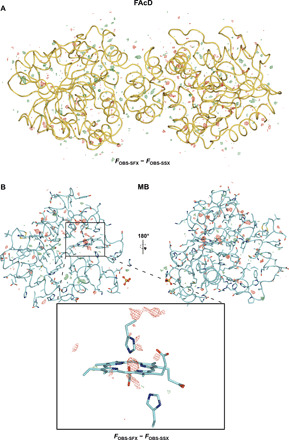
Fig. 3. Isomorphous difference maps for FAcD and MB, respectively.

Resolution shell–scaled Fobs-SFX − Fobs-SSX difference maps of FAcD (A) and MB (B). Difference map peaks are homogeneously distributed over FAcD, while difference map peaks are more concentrated around the radiation-sensitive heme center in MB. Proteins are shown as cartoon representations; all maps are shown at ±3 σ.
