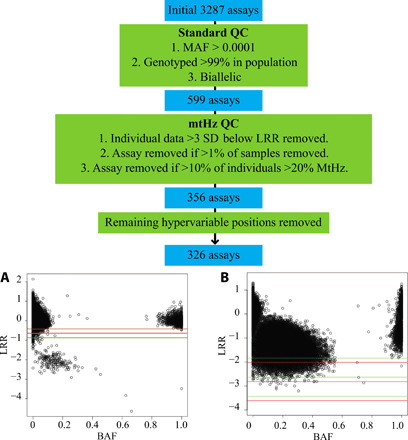
Fig. 1. Evaluation mitochondrial SNPs on the 23andMe v4 array.

The array includes 3287 positions across the mitochondrial genome. These were pruned to keep biallelic variants, with >99% call rate across the test population and minor allele frequency (MAF) > 0.001. Calls from individual participants at single SNPs were removed, where the intensity (LRR, log2 R ratio) was >3 SDs below the mean intensity for all individuals at that position. Where a position had >1% of samples fail these criteria, the position was removed for all individuals. (A) Well-performing assay with heteroplasmic samples between two homoplasmic clusters and a small number of samples with intensity >3 SDs below the mean value (lowest line) where individual calls were excluded. SD lines are shown for both the (A) (green) and (B) (red) allele assay. Assays that identified excessive heteroplasmy with poor homoplasmic clusters were entirely removed. (B) Poorly performing assay where >10% of the individuals in the dataset had MtHz of >20% [B-allele frequency (BAF) values, 0.2 to 0.8]. For this position, data from all individuals were removed from the analysis.
