
Figure 1.
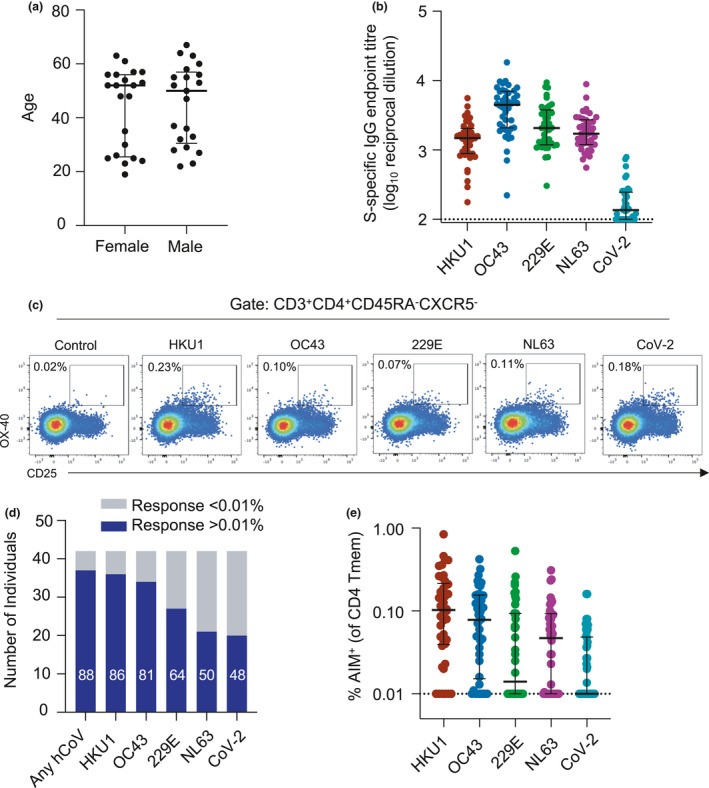
hCoV and CoV‐2 CD4 Tmem responses among healthy subjects. (a) Ages of the CoV‐2‐uninfected adult cohort participants (n = 21 female, n = 21 male). (b) Plasma samples were screened by ELISA for reactivity against S proteins from hCoV or CoV‐2 (n = 42). Data are presented as the reciprocal endpoint titre. Dashed line indicates the limit of detection of the assay. (c) Representative plots of coronavirus S‐specific CD4 Tmem (CD3+CD4+CXCR5−CD45RA−) from a single individual measured by OX‐40 and CD25 expression (control well stimulated with BSA). (d) Number of individuals with S‐specific responses greater than 0.01% of total Tmem for each indicated antigen (n = 42). Numbers in bars indicate the percentage of responders for each antigen. (e) Frequency of S‐specific Tmem for each antigen (n = 42). Lines indicate medians. Values represent background‐subtracted responses; frequencies below 0.01% after background subtraction were assigned a value of 0.01%.