
Figure 3.
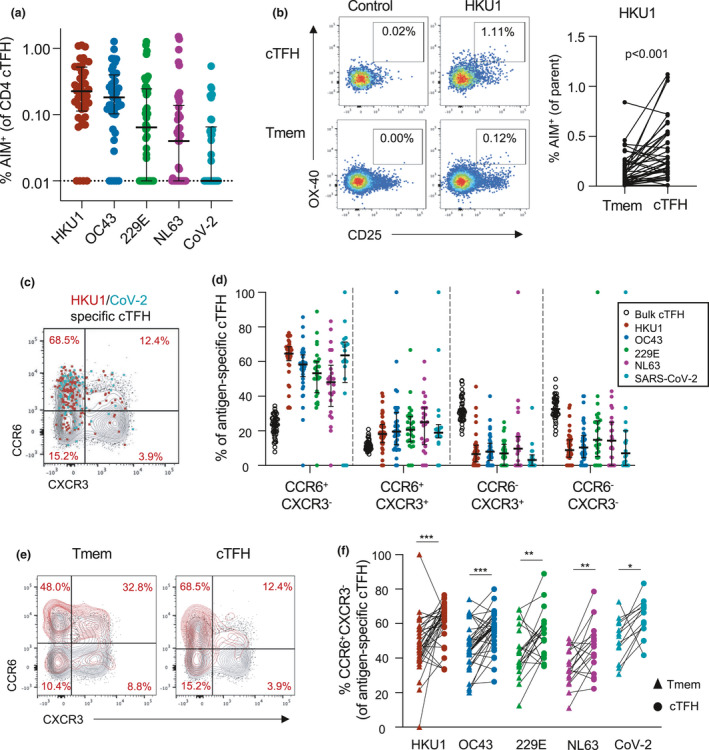
Memory and Th phenotype of hCoV and cross‐reactive CoV‐2 cTFH responses. (a) Frequency of S‐specific cTFH for each antigen (n = 42). Lines indicate median. Values represent background‐subtracted responses; frequencies below 0.01% after background subtraction were assigned a value of 0.01%. Data points are segregated and coded as individuals without (closed circles, n = 24) or with (open circles, n = 18) CoV‐2 cross‐reactive responses. (b) Comparison of HKU1 S‐specific T‐cell frequencies in Tmem or cTFH subsets. Plots indicate representative data from one donor. Graph shows compilation of responses from all donors (n = 42). (c) Representative staining of CCR6 and CXCR3 on the total cTFH population (black), HKU1‐specific (red) or CoV‐2‐specific cTFH (teal) in a single donor. (d) Quantification of Th phenotype among bulk cTFH (n = 42), HKU1 (n = 36), OC‐43 (n = 34), 229E (n = 27), NL63 (n = 21) or SARS‐CoV‐2 (n = 20)‐specific Tmem. (e) Representative CCR6/CXCR3 expression on bulk (black) or HKU1 S‐specific (red) Tmem and cTFH. (f) Paired comparison of the frequency of CCR6+CXCR3− cells among hCoV‐ or CoV‐2 S‐specific Tmem and cTFH populations among responding subjects. HKU, n = 34; OC43, n = 34; 229E, n = 21; NL63, n = 18; and CoV‐2, n = 13. Statistics was assessed by the Wilcoxon test. ***P < 0.001, **P < 0.01 and *P < 0.05.