
Figure 4.
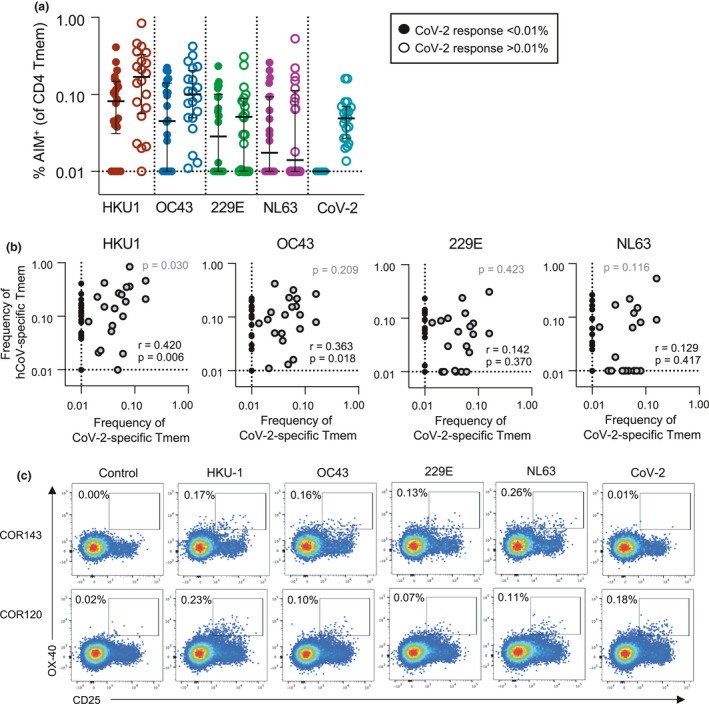
Correlation between HKU1 and CoV‐2 cross‐reactive Tmem responses. (a) Frequency of S‐specific Tmem for each antigen (n = 42). Lines indicate median. Values represent background‐subtracted responses; frequencies below 0.01% after background subtraction were assigned a value of 0.01%. Data points are segregated and coded as individuals without (closed circles, n = 22) or with (open circles, n = 20) CoV‐2 cross‐reactive responses. (b) The Spearman correlation between the frequency of CoV‐2 and hCoV S‐specific Tmem (n = 42, black text). P‐value correlation among individuals with CoV‐2 responses > 0.01% (n = 20, grey dots) is shown in grey text. (c) Representative staining of two healthy donors with S‐specific responses to all four hCoV antigens but differential responses to CoV‐2 S.