
Figure 5.
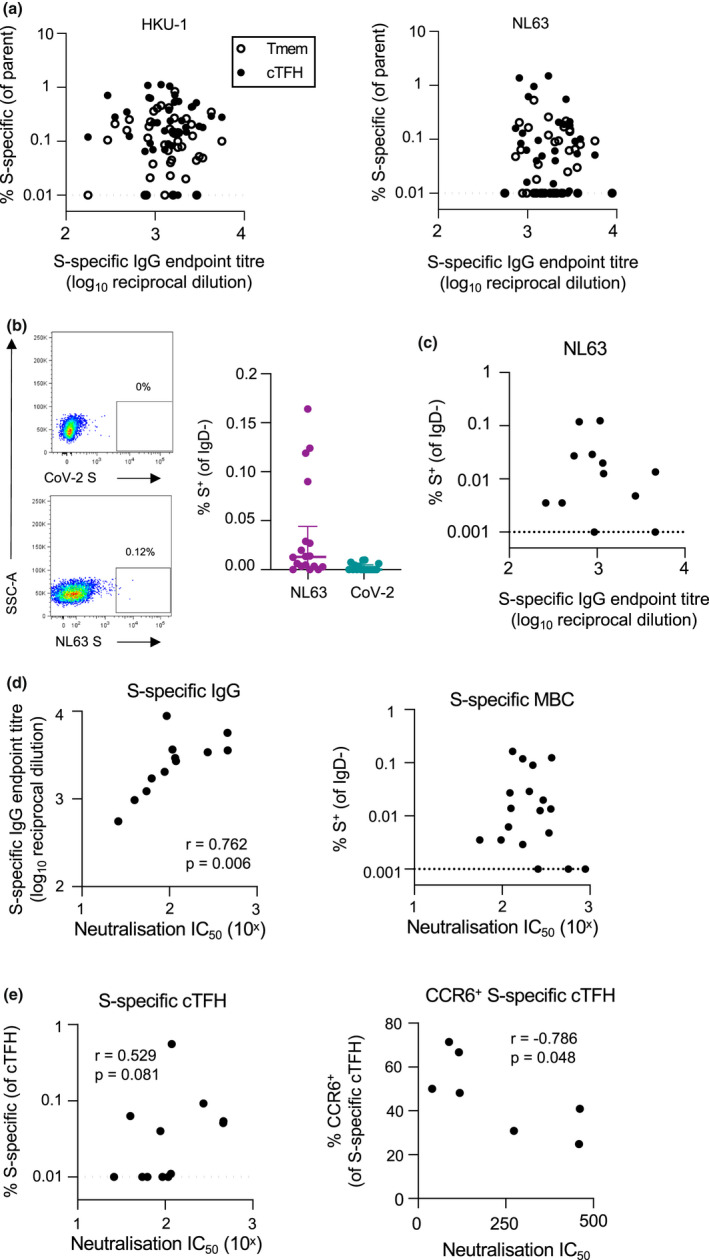
Relationship between serologic, T‐cell and B‐cell hCoV memory. (a) Spearman correlation between HKU1 or NL63 S‐specific IgG and the frequency of antigen‐specific Tmem or cTFH (n = 42). (b) Representative staining of IgD‐ B cells with NL63 or CoV‐2 probes and quantification of NL63 and CoV‐2 S‐specific MBC (n = 18). (c) Spearman correlation of NL63 S‐specific MBC and plasma binding IgG titres (n = 18). MBC frequency was assigned a minimum value of 0.001%. (d) Spearman correlation between plasma NL63‐neutralising activity and NL63 S‐specific IgG titres or MBC (n = 12). (e) Spearman correlation between NL63‐neutralising activity and either total NL63 S‐specific cTFH or the frequency of CCR6+ antigen‐specific cTFH.