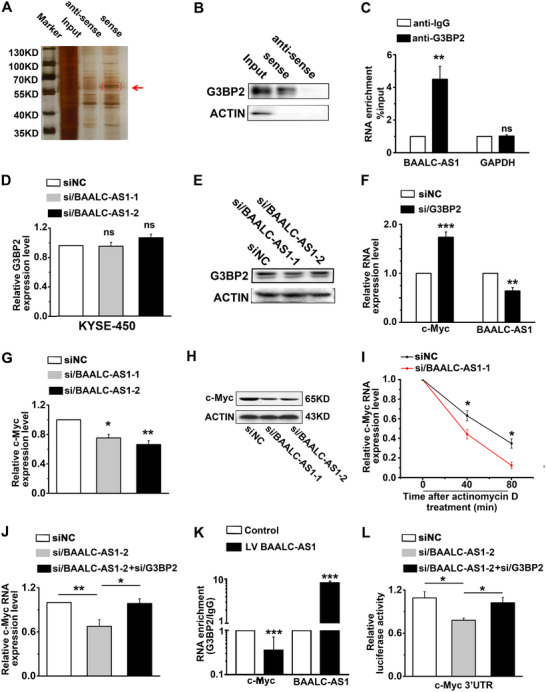
FIGURE 6.

BAALC‐AS1 directly interacts with G3BP2 to regulate the expression of c‐Myc. A. Identification of BAALC‐AS1‐binding proteins in KYSE‐450 cells using RNA pull‐down assay. The band specific to sense BAALC‐AS1 (pointed by the red arrow) was detected using LC‐MS/MS. B. Western blotting in the retrieved RNA pull‐down samples of KYSE‐450cells confirmed the direct interaction of BAALC‐AS1 and G3BP2. C. RIP assays were performed using G3BP2 and IgG antibody in KYSE‐450 cells. RT‐qPCR was performed to detect the RNA enhancement after BAALC‐AS1 knockdown. IgG antibody was used as negative control. D. Relative expression of G3BP2 quantified by RT‐qPCR after BAALC‐AS1 knockdown in KYSE‐450 cells. E. Western blotting analyses of the protein expression levels of G3BP2 after BAALC‐AS1 knockdown in KYSE‐450 cells. F. Expression of c‐Myc and BAALC‐AS1 quantified by RT‐qPCR after G3BP2 knockdown in KYSE‐450 cells. G. Expression of c‐Myc quantified by RT‐qPCR after BAALC‐AS1 knockdown in KYSE‐450 cells. H. Western blotting analyses of the protein expression levels of c‐Myc after BAALC‐AS1 knockdown in KYSE‐450 cells. I. BAALC‐AS1 knockdown reduced the stability of c‐Myc mRNA. si/BAALC‐AS1‐transfected KYSE‐450 cells were treated with 5 μg/mL actinomycin D for the indicated times. Relative c‐Myc mRNA expression levels were detected by RT‐qPCR. siNC‐transfected KYSE‐450 cells were used as control. J. Expression of c‐Myc quantified by RT‐qPCR after BAALC‐AS1 and G3BP2 knockdown in KYSE‐450 cells. K. RIP experiments were performed using G3BP2 antibody and IgG antibody in KYSE‐450 cells after BAALC‐AS1 overexpression. RT‐qPCR was performed to detect pulled‐down c‐Myc and BAALC‐AS1. IgG antibody was used as negative control. L. Silencing G3BP2 rescued the siBAALC‐AS1‐reduced luciferase activity of c‐Myc 3‐'UTR. NC, negative control; siRNA/BAALC‐AS1, small interfering RNA for BAALC‐AS1; siRNA/G3BP2, small interfering RNA for G3BP2; Vector, cells were infected with empty lentiviruses; BAALC‐AS1, cells were infected with lentiviruses expressing BAALC‐AS1. *, P < 0.05; **, P < 0.01; ***, P < 0.001. All values are expressed as the mean ± SEM of 3 experiments.
