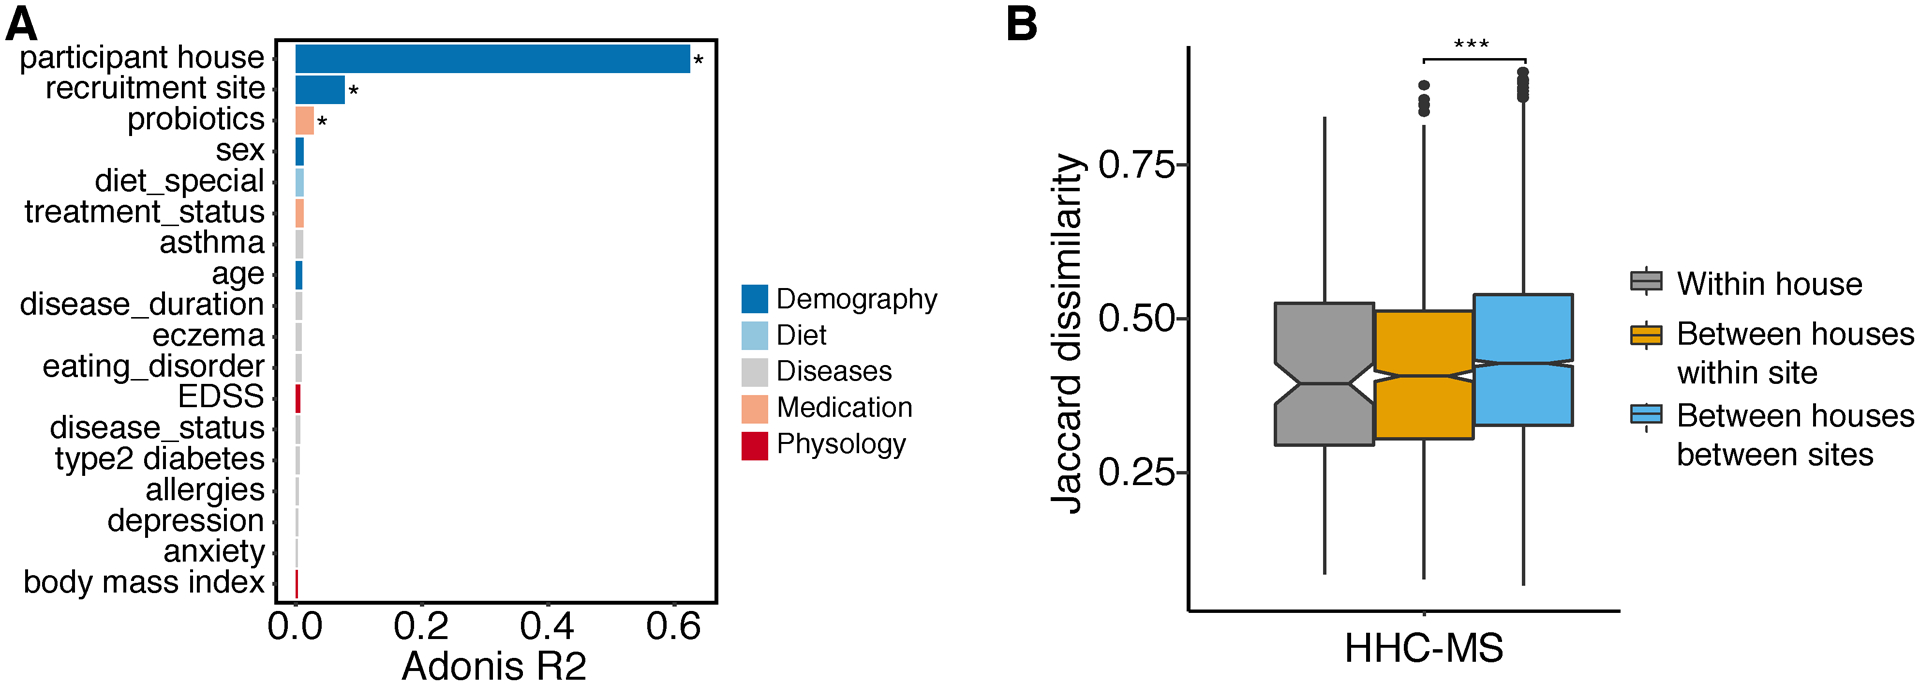
Figure 7.

Dietary dissimilarity. (A) Bar plot showing the size effect (Adonis R2) of confounders associated with dietary variations (Jaccard dissimilarity). Confounders showing significant impact on gut microbiome were labeled (PERMANOVA, multiple testing corrected P value, *P ≤ 0.05). (B) Jaccard dissimilarity of dietary intakes measured between healthy control and MS within the same house, between different houses in the same time and between different houses in different sites. Random comparisons of healthy control and MS were female-male matched only to control sex effect. Statistical significance was determined by ANOVA (multiple testing corrected P value, ***P ≤ 0.001).
