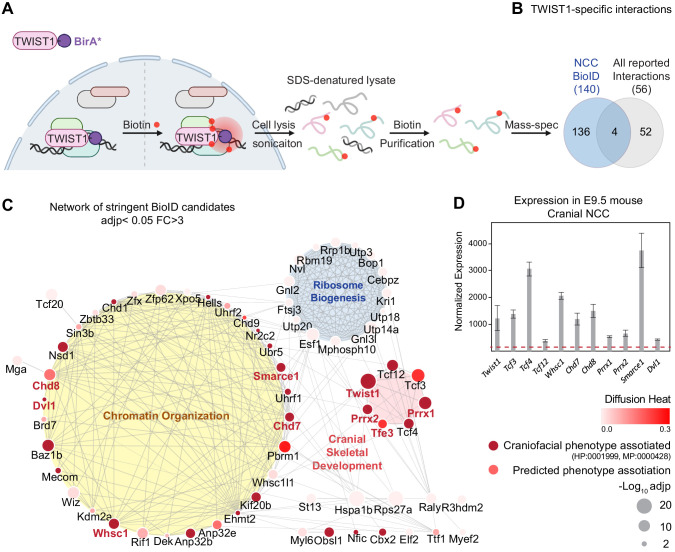
Figure 1. TWIST1 interactome in cranial NCCs revealed using BioID and network propagation.
(A) BioID procedure to identify TWIST1-interacting partners in neural crest stem cells (NCCs). TWIST1-BirA* (TWIST1 fused to the BirA* biotin ligase) labeled the proteins partners within the 10 nm proximity in live cells. Following cell lysis and sonication, streptavidin beads were used to capture denatured biotin-labeled proteins, which were purified and processed for mass spectrometry analysis. (B) TWIST1-specific interaction candidates identified by BioID mass-spectrometry analysis in NCC cell line (p<0.05; Fold-change >3; PSM#>2) overlap with all reported TWIST1 interactions on the Agile Protein Interactomes DataServer (APID) (Alonso-López et al., 2019). (C) Networks constructed from stringent TWIST1-specific interaction at a significant threshold of adjusted p-value (adjp) <0.05 and Fold-change >3. Unconnected nodes were removed. Top GO terms for proteins from three different clusters are shown. Node size = -Log10 (adjp). Genes associated with human and mouse facial malformation (HP:0001999, MP:0000428) were used as seeds (dark red) for heat diffusion through network neighbors. Node color represents the heat diffusion score. (D) Expression of candidate interactor genes in cranial neural crest from E9.5 mouse embryos; data were derived from published transcriptome dataset (Fan et al., 2016). Each bar represents mean expression ± SE of three biological replicates. All genes shown are expressed at level above the microarray detection threshold (27, red dashed line).


