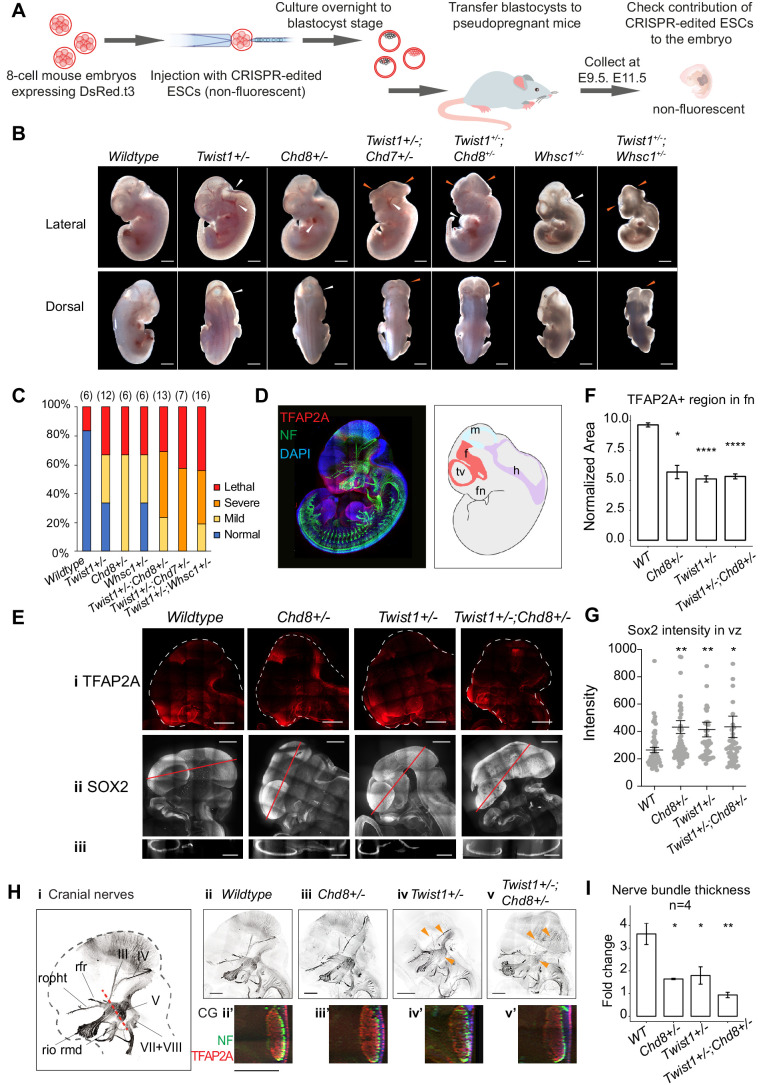
Figure 3. Genetic interaction of Twist1 and chromatin regulators in craniofacial morphogenesis.
(A) Experimental strategy for generating chimeric mice from WT and mutant ESCs (see Materials and methods). (B) Lateral and dorsal view of mid-gestation chimeric embryos with predominant ESC contribution (embryos showing low or undetectable red fluorescence). Genotype of ESC used for injection is indicated. Scale bar: 1 mm. Heterozygous embryos of single genes (Twist1+/-, Chd8+/-, Whsc1+/-) showed mild defects including hemorrhages and mild neural tube defect (white arrowheads). Compound heterozygous embryos displayed open neural tube and head malformation (orange arrowheads, n ≥ 6 for each genotype, see panel 3C), in addition to heart defects. (C) Proportions of normal and malformed embryos (Y-axis) for each genotype (X-axis). Severity of mutant phenotypes was determined based on the incidence of developmental defects in the neuroepithelium, midline tissues, heart and vasculature: Normal (no defect); Mild (1–2 defects); Severe (3–4 defects), and early lethality. The number of embryos scored for each genotype is in parentheses. (D) Whole-mount immunofluorescence of E11.5 chimeras derived from wildtype ESCs, shows the expression of TFAP2A (red) and neurofilament (NF, green) and cell nuclei by DAPI (blue). Schematic on the right shows the neuroepithelium structures: f, forebrain; m, midbrain; h, hindbrain; tv, telencephalic vesicle; fn, frontonasal region. (E) (i) NCC cells, marked by TFAP2A, and neuroepithelial cells, marked by SOX2, are shown in (ii) sagittal, and (iii) transverse view of the craniofacial region (red line in ii: plane of section). (F) Quantification of frontal nasal TFAP2A+ tissues (mean normalized area ± SE) of three different sections of embryos of each genotype. (G) SOX2 intensity (mean ± SE) in the ventricular zone of three sections of embryos of each genotype were quantified using IMARIS. (H) (i) Cranial nerves visualized by immunostaining of neurofilament (NF). (ii–v) Maximum projection of cranial nerves in embryos. Missing or hypoplastic neurites are indicated by arrowheads. (ii'–v') Cross-section of neurofilament bundles in the trigeminal ganglion. Red dashed line in i: plane of section. Bar: 500 μm; V, trigeminal ganglion; III, IV, VII, VIII; rio, infraorbital nerve of V2; rmd, mandibular nerve; ropht, ophthalmic profundal nerve of V1; rfr, frontal nerve. (I) Thickness of neural bundle in the trigeminal ganglion was measured by the GFP-positive area, normalized against area of the trigeminal ganglion (TFAP2A+). Values plotted represent mean fold change ± SE. Each condition was compared to WT. p-Values were computed by one-way ANOVA. *p<0.05, **p<0.01, ***p<0.001, ****p<0.0001. ns, not significant.


