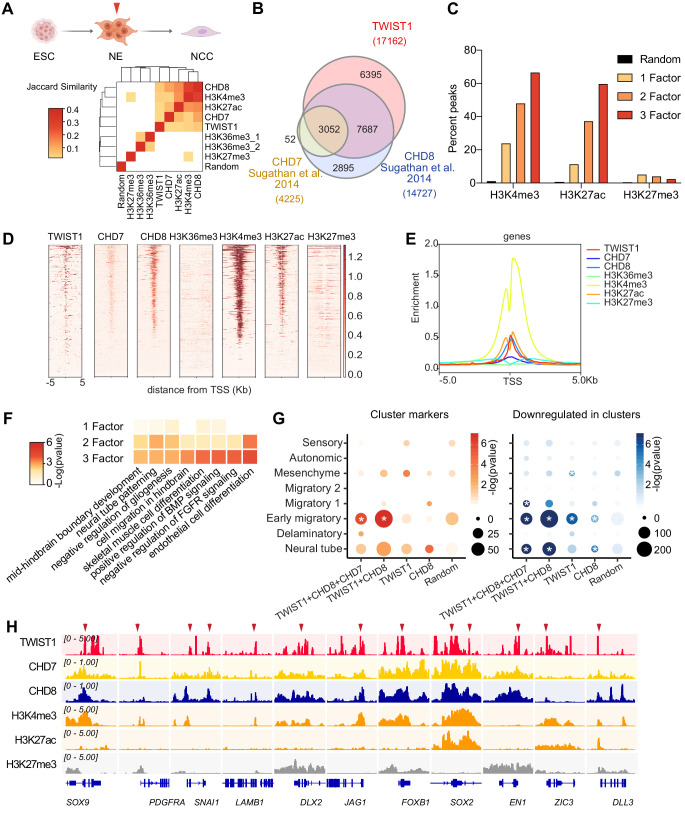
Figure 4. Genomic region showing overlapping binding of TWIST1 and partners are enriched for active regulatory signatures and neural tube patterning genes.
(A) Top panel: Trajectory of ESC differentiation to neuroepithelial cells (NECs) and NCCs. Bottom panel: Jaccard Similarity matrix generated of ChIP-seq data of TWIST1, CHD7, CHD8, and histone modifications from NE cells. The Jaccard correlation is represented by a color scale. White squares indicate no significant correlation (p<0.05, fisher’s exact test) or odds ratio <10 between the two datasets. (B) Venn diagram showing overlaps of putative direct targets of TWIST1, CHD7, and CHD8, based on ChIP-seq datasets for NECs (Sugathan et al., 2014). (C) Percent genomic region that is marked by H3K4me3, H3K27ac, and H3K27me3 among regions bound by one, two or all three factors among TWIST1, CHD7, and CHD8. Randomized peak regions of similar length (1 kb) were generated for hg38 as a control. (D) Heatmaps of genomic footprint of protein partners at ± 5 kb from the TSS, based on the ChIP-seq datasets (as in A) and compared with histone marks H3K4me3, H3K27ac, and H3K27me3 in human neural progenitor cells (Ziller et al., 2015). TSS lanes with no overlapping signals were omitted. (E) ChIP-seq density profile (rpkm normalized) for all TSS flanking regions shown in D. (F) Gene Ontology analysis of genomic regulatory regions by annotations of the nearby genes. Regions were grouped by presence of binding site of individual factor (TWIST1, CHD7, and CHD8), or by 2–3 factors in combination. The top non-redundant developmental processes or pathways for combinatorial binding peaks or individual factor binding peaks are shown. p-Value cut-off: 0.05. (G) Enrichment of TWIST-chromatin regulator targets among regulons of different NCC single-cell clusters at E8.5-E10.5 (Soldatov et al., 2019). Number of overlapping genes with DNA binding peaks (TSS ± 1 kb) for each TF combination are represented by dot size and -log(p-value) is represented by color gradient. Gene modules with significant enrichment (p<0.05) are labeled with asterisk. A random set of genes from the scRNA-seq, with number comparable to the largest TF binding group (1000 genes) were used as control. (H) IGV track (Robinson et al., 2011) showing ChIP-peak overlap (red arrows) at common transcriptional target genes in cell mobility (Sox9, Pdgfra, Snai1, Lamb1, Dlx2) in NCC development and neurogenesis (Jag1, Foxb1, Sox2, En1, Zic3, Dll3) repressed at early migration. Gene diagrams are indicated (bottom row).


