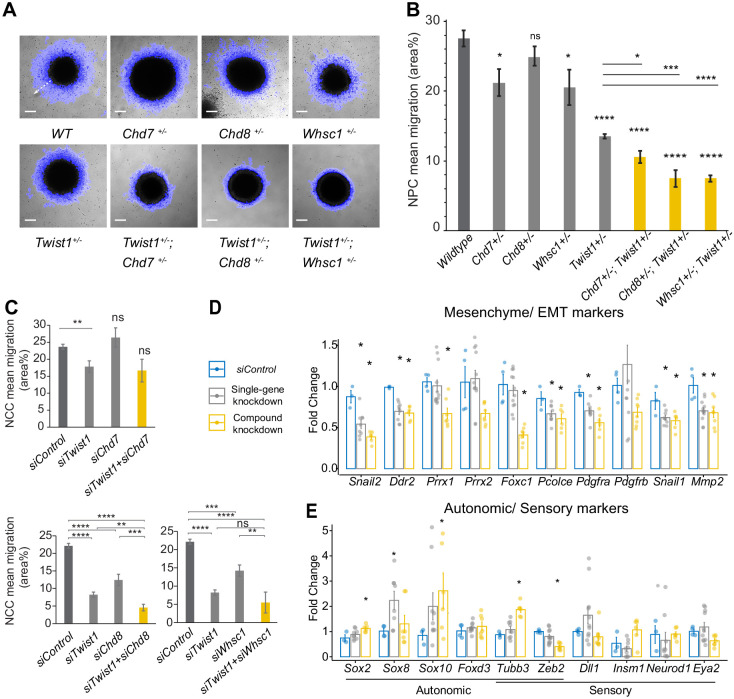
Figure 6. The TWIST1-chromatin regulators are necessary for cell migration and the NCC ectomesenchyme potential.
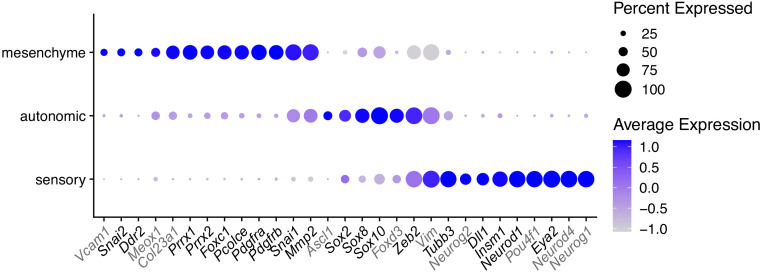
(A) Dispersion of cells from the colony over 10 hr period in vitro (blue halo area). White arrow (shown in wildtype, WT) indicates the centrifugal cell movement. Bright-field time-lapse images were captured at set tile regions. Bar = 0.2 mm (B) Cell migration over 10 hr was quantified from time-lapse imaging data and plotted as mean area % ± SE for each cell type. n = 5 for each genotype. p-Values were computed by one-way ANOVA with Holm-sidak post-test. (C) Results of the scratch assay of O9-1 cells with siRNA knockdowns of Twist1, Chd7, Chd8, Whsc1, and control siRNA. Bright-field images were captured at set tile regions every 15 min over 10 hr. Cell migration was measured as mean area % traversed ± SE, in triplicate experiments for each genotype. Each condition was compared to WT. p-Values were computed by one-way ANOVA. *p<0.05, **p<0.01, ***p<0.001, ****p<0.0001. ns, not significant. (D, E) RT-qPCR quantification of expression of genes associated with EMT/ectomesenchyme, autonomic and sensory neuron fates, selected from E8.5-E10.5 mouse NCC scRNA-seq data. Gene expression is represented as fold change against control ± SE. The bar diagram shows the expression fold changes in cells treated with siRNA individually for Twist/ Chd8 or Whsc1 (pooled result of the treatments, gray bar) and siRNA for Twist1 in combination with Chd8 or Whsc1 (pooled result of the treatments, yellow bar). Expression were normalized with the average expression of three housekeeping genes (Gapdh, Tbp, Actb). Each group was compared to control knockdown treatment. p-Values were computed by one-way ANOVA. *p<0.05.


