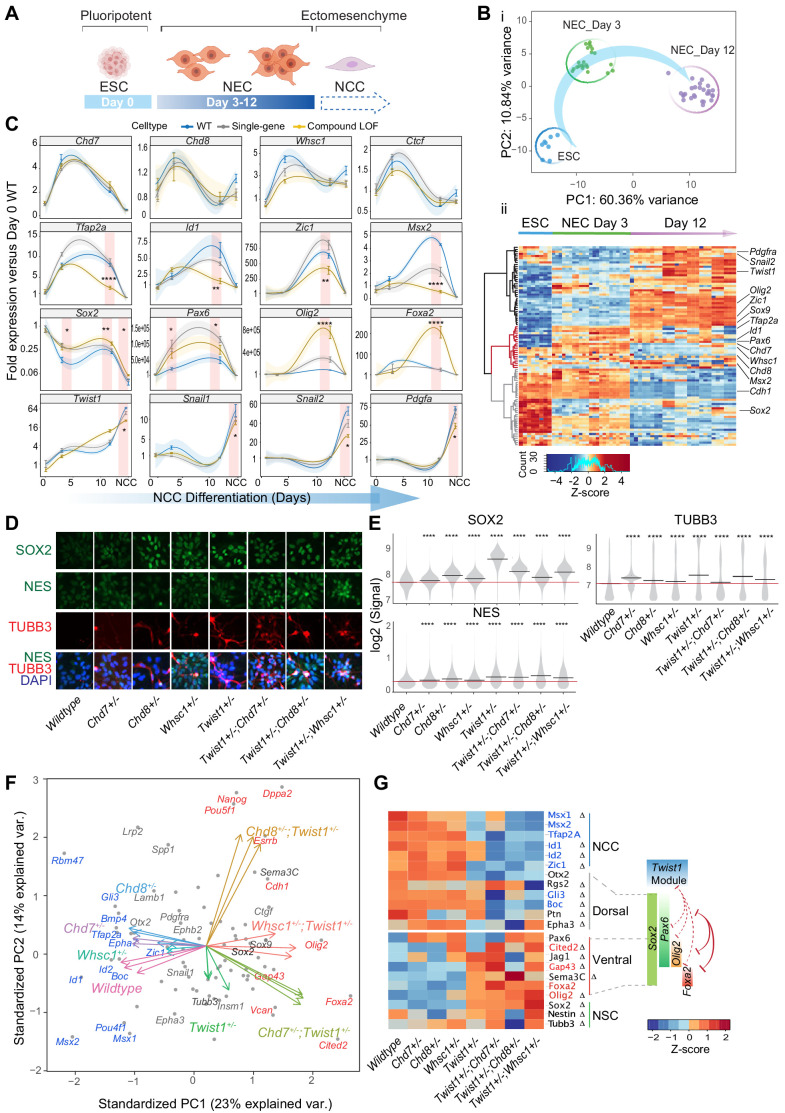
Figure 7. The TWIST1-chromatin regulators predispose NCC propensity and facilitate dorsal-ventral neuroepithelial specification.
(A) Experimental strategy of neural differentiation in vitro (Bajpai et al., 2010; Varshney et al., 2017). (B) (i) Principal component analysis (PCA) of the Fluidigm high-throughput qPCR data for all cell lines collected as ESC, and neuroepithelial cells (NECs) at day 0, day 3, and day 12 of differentiation, respectively. Differentiation trajectory from ESC to NEC is shown for the first two PC axes. (ii) Heatmap clustering of normalized gene expressions for all cell lines: n = 3 for each genotype analyzed at day 3 and day 12 of neuroepithelium differentiation and n = 1 for ESCs. Clusters indicate activated (black), transiently activated (red) and repressed (gray) genes during neural differentiation. Z-score (color-coded) is calculated from log2 transformed normalized expression. (C) Profiles of expression of representative genes during neural differentiation (day 0 to NCC). Mean expression ± standard error (SE) are plotted for wildtype, single-gene heterozygous (average of Twist1+/-, Chd7+/-, Chd8+/-, and Whsc1+/-) or compound heterozygous (average of Twist1+/-;Chd7+/-, Twist1+/-;Chd8+/-, and Twist1+/-;Whsc1+/-) groups. For NCCs, samples were collected O9-1 cells with siRNA knockdown of single-gene or combinations of Twist1 and one of the partners. Gene expression were normalized against the mean expression value of three housekeeping genes (Gapdh, Tbp, Actb), and then the expression of day 0 wild-type ESCs. Shading of trend line represents 90% confidence interval. Red stripes indicate stages when target gene expressions were significantly affected by the double knockdown. -Values were calculated using one-way ANOVA. *p<0.05, **p<0.01, ***p<0.001, ****p<0.0001. ns, not significant. (D) Immunofluorescence of SOX2 and selected NSC markers and (E) quantification of signal intensity ± SE in single cells of indicated genotypes (X-axis). p-Values were generated using one-way ANOVA with Holm-sidak post-test. *p<0.05, **p<0.01, ***p<0.001, ****p<0.0001. (F) PCA plot of the NECs (day 12) showing genes with highest PC loadings (blue = top 10 loading, red = bottom 10 loading), and vector of each genotype indicating their weight on the PCs. (G) Heatmap of genes associated with neural tube to NCC transitions: NCC specifiers, dorsal-, ventral-, pan-NSC in mutant versus wild-type NECs. Progenitor identities along the neural tube, the reported master TFs and the co-repression (red solid line) of dorsal and ventral progenitors are illustrated on the right (Briscoe et al., 2000; Alaynick et al., 2011; Kutejova et al., 2016). Repression (red) or promotion (green) of cell fates by TWIST1-module based on the perturbation data are indicated in dashed lines. Genes with the highest PC loadings were indicated in same colors as in D. Z-scores (color-coded) were calculated from Log2 fold-change against wildtype cells. Changes in gene expressions were significant (by one-way ANOVA). Genes identified as targets in at least two ChIP-seq datasets among TWIST1, CHD7, and CHD8 are labeled with ∆.


