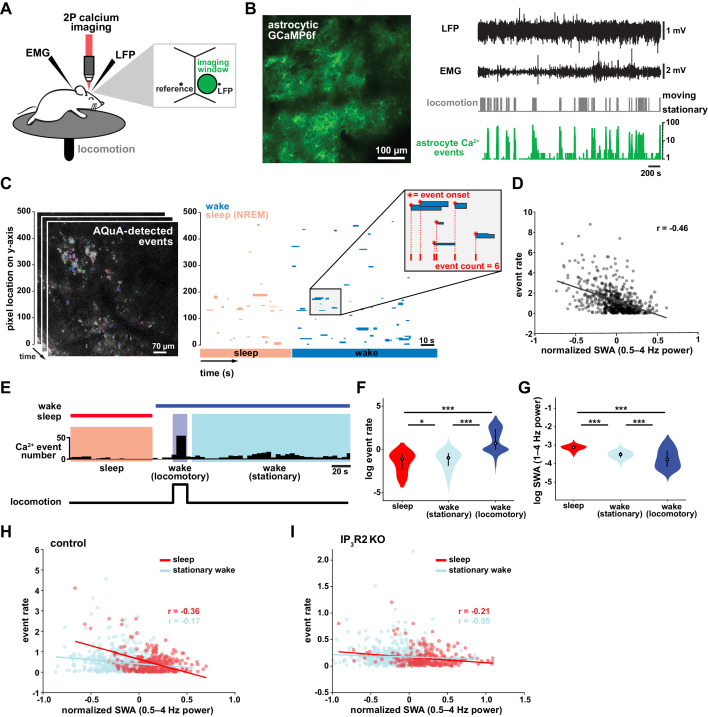
Figure 1. Cortical astrocyte Ca2+ event rate and SWA are negatively correlated across behavioral states.
(A) Experimental in vivo imaging and electrophysiology setup. Mice expressing astrocytic GCaMP6f were head-fixed on a horizontal treadmill to record astrocyte Ca2+, LFP, EMG, and locomotion. (B) Left: example image of GCaMP6F expression in L2/3 V1 astrocytes in an awake, head-fixed mouse. Right: example of LFP, EMG, locomotion, and astrocyte Ca2+ event data using this experimental setup. (C) Left: AQuA (Wang et al., 2019) detects astrocyte Ca2+ events in 3 min GCaMP time series. Right: representative spatiotemporal plot of AQuA-identified Ca2+ events displaying event time and duration on the x-axis, and the unidimensional (y) spatial extent on the y-axis. Events are color-coded by behavioral state (wake=blue, NREM sleep=pink). Inset demonstrates that event count throughout paper is quantified using event onset. (D) Ca2+ event rate and SWA are negatively correlated (Pearson’s correlation, p<0.0005). Each point represents a single 2 min bin (for all data in this figure except panel I, n = 4 mice, 19 hr). (E) Example of Ca2+ event rate (bottom row) across three behavioral states: NREM sleep, locomotory wake, and stationary wake. (F) Across animals, Ca2+ event rate is lowest during sleep, higher during stationary wake, and highest during locomotory wake, while (G) the inverse is true for SWA (for F and G, rank sum test, data are represented as median, 25th and 75th percentile). (H) Ca2+ event rate and SWA are negatively correlated within each behavioral period: sleep (red, Pearson’s correlation, p<0.0005) and stationary wake (cyan, Pearson’s correlation, p<0.0005) (I), but Ca2+ events in IP3R2 KO mice are less correlated with SWA in sleep (Pearson’s correlation, p<0.0005) and stationary wake (Pearson’s correlation, p>0.05, n = 5 mice, 22 hr).


