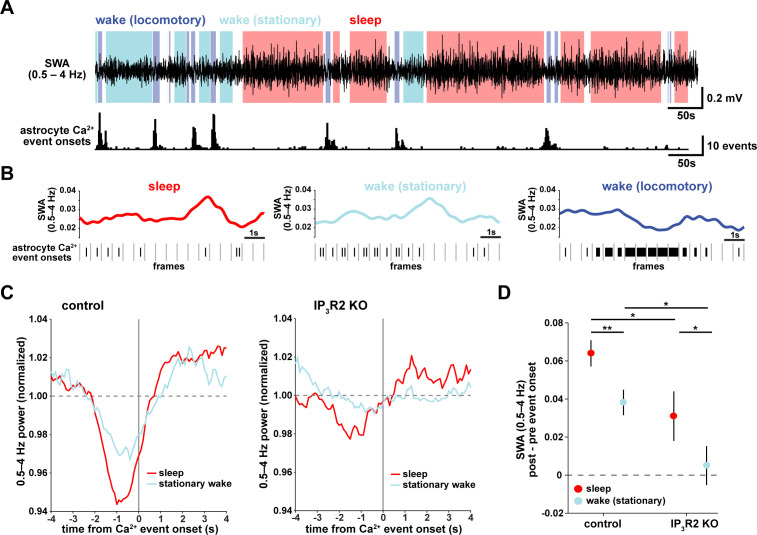
Figure 2. Astrocyte Ca2+ events characterize transitions from low to high SWA.
(A) Example of SWA obtained by filtering LFP (0.5–4 Hz) recordings (top), with corresponding astrocyte Ca2+ events (bottom). Behavioral state denoted by color: sleep (red) and wake (locomotory in blue, stationary in cyan). (B) Example traces of SWA fluctuations for each behavioral state (top) and raster plot of Ca2+ events (below) to demonstrate that across behavioral states, SWA fluctuates at similar levels. (C) Left: Average Ca2+ event-triggered traces reveal astrocyte Ca2+ event onsets occur after a relative decrease in SWA and are followed by an increase in SWA during sleep (red) and stationary wake (cyan). Right: This relationship is diminished in IP3R2 KO mice, where less modulation around Ca2+ events is observed. Line width=SEM (control: n = 4 mice, 19 hr; IP3R2 KO: n = 5 mice, 22 hr). (D) SWA modulation across the 2 s before and after Ca2+ onset demonstrates modulation is highest during sleep (red) and dependent on expression of IP3R2 (rank sum test, data represented as mean± SEM).

