. 2021 Mar 17;10:e63329. doi: 10.7554/eLife.63329

Figure 3. Astrocytic Gi-DREADD-driven Ca2+ increases are sufficient to increase SWA during sleep.

(A) Experimental setup. Mice were co-injected with GFAP-cyto-GCaMP6f and GFAP-hM4D(Gi)-mCherry AAVs. After I.P. injection of either 1 mg/kg CNO or saline, astrocyte Ca2+, LFP, EMG, and locomotion were recorded. (B) Post-experiment immunohistochemistry demonstrates astrocyte-specific expression of Gi-DREADD and GCaMP6f. mCherry+ cells (red) exhibit typical astrocyte morphology and do not co-localize with neurons (NeuN, blue). (C) Representative astrocyte Ca2+ response in one animal in which CNO (pink, bottom) causes increased Ca2+ events compared with saline (gray, top). (D) Left: Cumulative Ca2+ event count for all mice after CNO (pink) shows higher event rate compared to saline (gray). Error bars=SEM. (n = 10 mice, 1 hr recordings). Right: Change in event rate for each mouse with CNO compared to saline (paired t-test). For panels D–J, data are represented by the mean for each individual animal, and the population as mean± SD. (E) Left: Administration of CNO (pink) results in rightward shift of the SWA distribution during sleep compared to saline (gray), using 5 s bins. Right: Summary statistics, by animal, show increased SWA during sleep after CNO. (for panels E–H, n = 9 mice, 2 hr recordings, paired t-test) (F) Percent time in NREM sleep does not differ between saline and CNO conditions. (G) Distribution of SWA (left) and summary statistics across mice (right) show that SWA during wake, in contrast with sleep (E), is unchanged between conditions. (H) Percent time awake, similar to time in NREM sleep (F), is similar between conditions. (I) CNO administration (orange) in IP3R2 KO mice expressing astrocytic Gi-DREADDs causes no significant change in Ca2+ event number compared to saline (gray) as shown by the cumulative event count (left, error bars = SEM) and summary statistics per mouse (right, paired t-test) (for experiments in I–J, n = 5 mice, 2 hr recordings). (J) Distribution of SWA during sleep (left) and summary statistics (right) show that, in contrast to controls (E), sleep SWA is unchanged between saline (gray) and CNO (orange) conditions in IP3R2 KO mice (paired t-test).

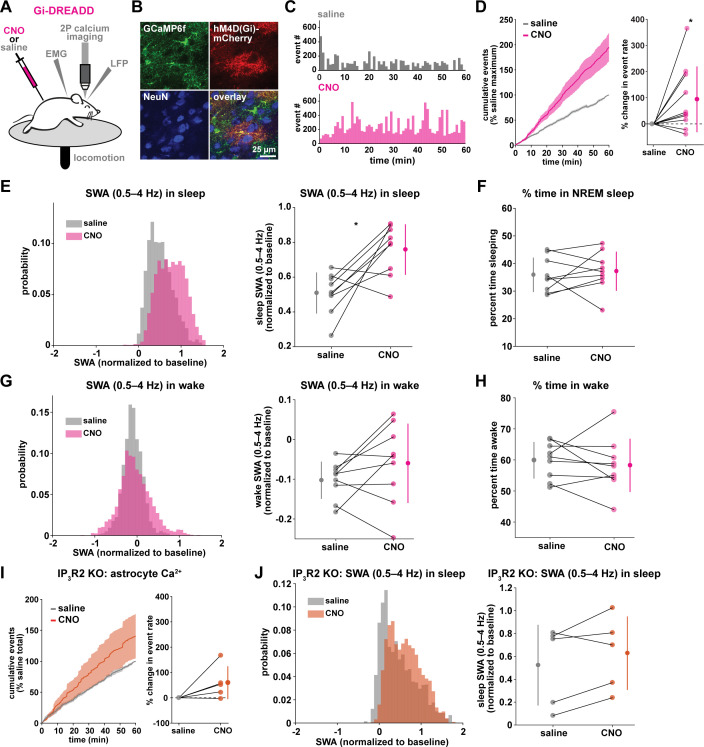
Figure 3.

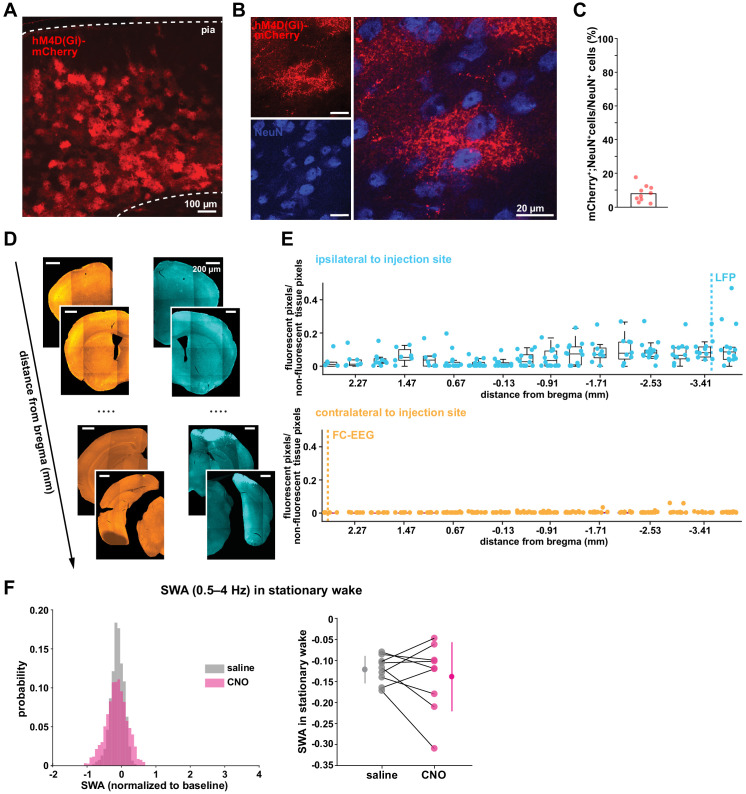
Figure 3—figure supplement 1. Astrocyte-specific expression of Gi-DREADDs across ipsilateral and contralateral cortex.

Figure 3—figure supplement 1.

(A) Representative post-experiment immunohistochemistry demonstrating widespread astrocyte-specific expression of Gi-DREADDs across cortical layers. Note stereotypical bush-like astrocytic morphology of mCherry+ cells. (B) Representative ×63 magnification confocal immunohistochemistry images of mCherry (red) and NeuN (blue) staining used to identify non-specific expression of DREADDs. (C) Percentage of NeuN+ identified cells that were also mCherry+. (D) Schematic demonstrating analysis of cortex-wide Gi-DREADD expression spread on the hemisphere ipsilateral and contralateral to the viral injection site. (E) Expression spread in brain slices sampled from rostral to caudal for the ipsilateral (top, cyan) and contralateral hemisphere (bottom, orange) demonstrates expression is highest in the ipsilateral rostral brain areas, near the LFP recording site (dashed line, cyan). There is no expression near the FC-EEG recording site (dashed line, yellow). Expression spread for each slice was calculated by normalizing the number of fluorescent pixels to the size of the brain tissue. Data represented with boxplots marking the medians, 25th and 75th percentiles. (F) Distribution of SWA (left), and summary statistics across mice (right, paired t-test) show that SWA during stationary wake, similar to all wake (Figure 3G) and in contrast with sleep (Figure 3E), is unchanged between saline and CNO conditions (n = 9 mice, 2 hr recordings). Data represented by mean for each animal and population mean± SD.
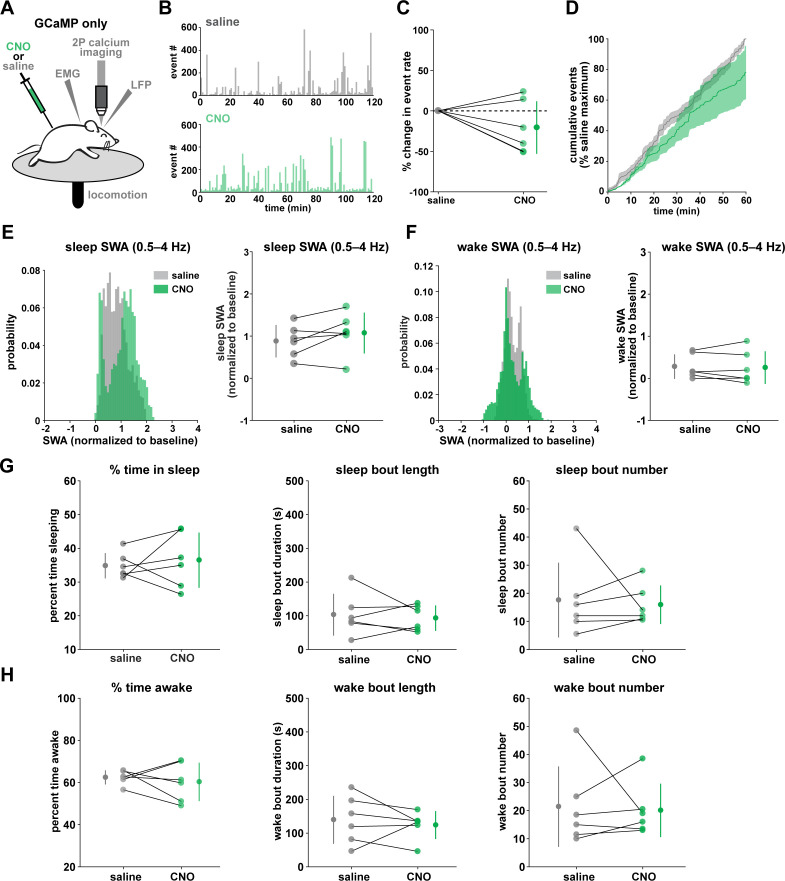
Figure 3—figure supplement 2. Systemic administration of CNO does not affect astrocyte Ca2+ dynamics, SWA, or sleep and wake behavior.

Figure 3—figure supplement 2.

(A) Experimental setup. Mice were injected with only GFAP-cyto-GCaMP6f AAV. After I.P. injection of either 1 mg/kg CNO or saline, astrocyte Ca2+, LFP, EMG, and locomotion were recorded to assess effects of CNO. (B) Example astrocyte Ca2+ response in one animal in which CNO (green, bottom) does not change Ca2+ event number compared with saline (gray, top). (C) Ca2+ event rate with CNO demonstrates no significant change across mice compared to saline (paired t-test, data represent mean for each mouse and population mean± SD, n = 6 mice, 2 hr recordings) (D) Cumulative Ca2+ event count for all mice shows no change between CNO (green) and saline (gray) conditions (error bars=SEM, n = 6 mice, 1 hr recordings). (E) Left: Administration of CNO (green) does not change SWA distribution during sleep compared to saline (gray), using 5 s bins. Right: Summary statistics show no change in SWA during sleep after CNO (for E–H, data represented by mean for each animal and population mean± SD, n = 6 mice, 2 hr recordings, paired t-test). (F) Left: CNO (green) does not change SWA distribution during wake compared to saline (gray), using 5 s bins. Right: No change in SWA during wake after CNO. (G) Time spent in NREM sleep (left), mean sleep bout length (middle), and mean sleep bout number (right) do not differ between saline and CNO conditions. (H) Time spent in wake (left), mean wake bout length (middle), and mean wake bout number (right) do not differ between saline and CNO conditions.
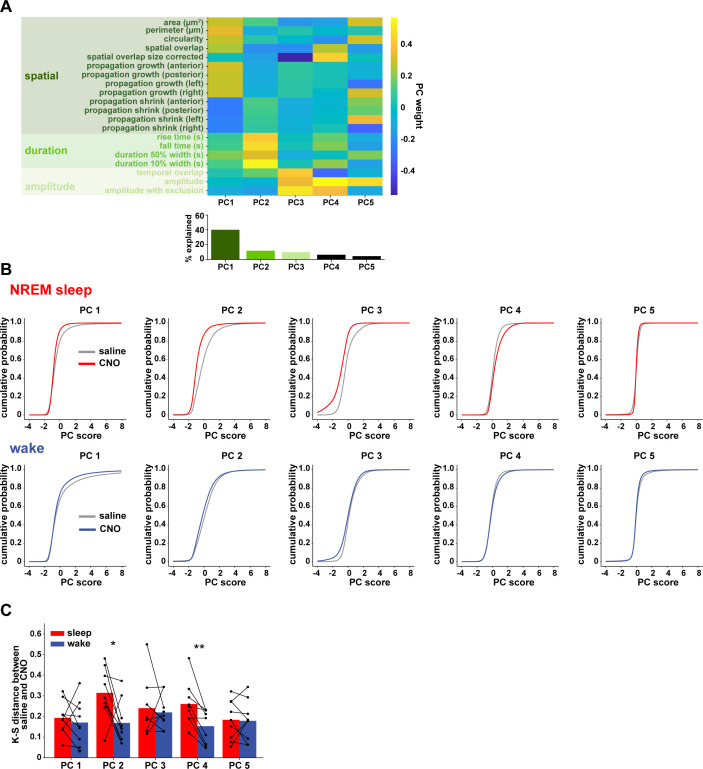
Figure 3—figure supplement 3. PCA shows that Gi-DREADD activation causes increased changes in Ca2+ event properties during sleep compared to wake.

Figure 3—figure supplement 3.

(A) Top: Weight matrix extracted from PCA, incorporating 20 Ca2+ event properties obtained with AQuA (n = 10 mice; 2 hr recordings; 204,172 events). PC 1 largely represents spatial features, PC 2 represents temporal features, and PC 3 represents features associated with amplitude. Bottom: Percent of variance explained by each PC. (B) Top: Cumulative distribution of the score for each PC for sleep events after saline or CNO administration, demonstrating clear differences in multiple PCs compared with wake (bottom). Bottom: Cumulative distribution of the score for each PC for wake events is similar between saline and CNO (n = 10 mice for saline, nine mice for CNO condition, 2 hr recordings; 33,882 sleep events; 153,646 wake events). (C) K-S distance between the saline and CNO distributions in panel B demonstrates significant differences between sleep and wake in the effect of CNO on PC 2, PC 4, and PC 5 (Wilcoxon signed rank test, n = 9 mice, median event number/mouse = 4139).