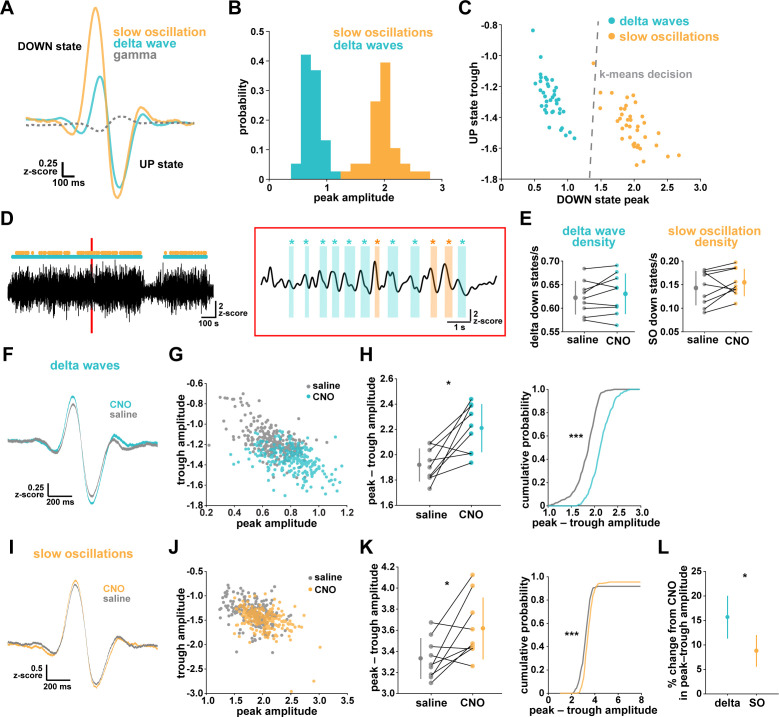
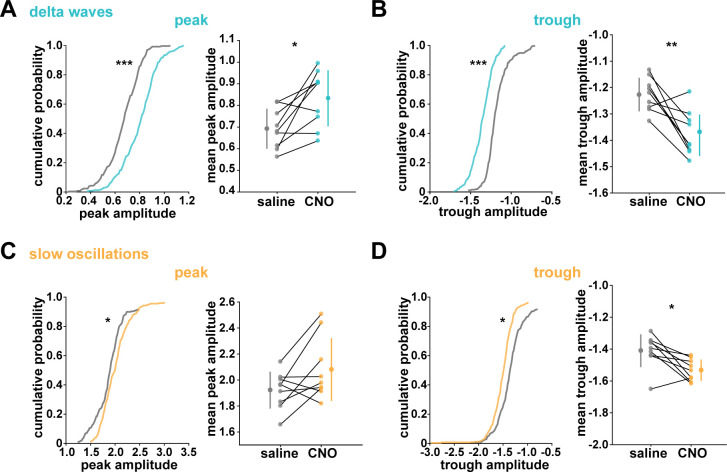
Figure 4. Astrocytic Gi-DREADD activation regulates local delta waves more than slow oscillations.
(A) Mean of all identified slow oscillations (orange) and delta waves (cyan) (n = 31,966,966 delta waves, 7855 slow oscillations) in saline condition, including mean LFP amplitude filtered for high-gamma (gray, 80–100 Hz) demonstrating lower gamma during DOWN state and higher gamma during UP state (for panels A–C, n = 10 mice, 38 hr). (B) Peak amplitude separation between slow oscillations and delta waves. (C) Peak vs. trough amplitude for slow oscillations and delta waves is separable by K-means clustering (dashed line). (D) Left: Example of filtered LFP (0.1–4 Hz) for a 20-min recording. Slow oscillations (orange) and delta waves (cyan) indicated. Right: A 10 s window corresponding to the red box, with example waveforms of individual slow oscillations and delta waves. (E) Delta wave (left) and slow oscillation (right) rates do not change between conditions (for panels E; H, left; K, left; and L, data represented by mean for each animal, and the population as mean± SD, n = 9 mice 2 hr recordings, paired t-test). (F) Delta waves with CNO (cyan) show higher peak and trough amplitude compared with saline (gray) (saline: n = 10 mice, 16,467 waveforms; CNO: n = 9 mice, 15,499 waveforms). (G) Peak vs. trough amplitude for delta waves after CNO (cyan) is shifted compared with saline controls (gray) (for panels G; H, right; J; K, right, saline: n = 10 mice, 257 sleep periods, CNO: n = 9 mice, 246 sleep periods). (H) Left: Peak minus trough delta wave amplitude is higher with CNO. Right: Cumulative distribution reveals a leftward shift in the peak minus trough delta wave amplitude with CNO (two-sample Kolmogorov-Smirnov test). (I) Slow oscillations show minimal peak and trough amplitude change with CNO (orange) relative to saline (gray), compared with delta waves (F) (saline: n = 10 mice, 3995 waveforms, CNO: n = 9 mice, 3860 waveforms). (J) Peak versus trough amplitude for slow oscillations is similar between CNO (orange) and saline (gray) conditions, compared with delta waves (G). (K) Left: Peak minus trough slow oscillation amplitude shows a smaller, but significant, increase with CNO compared with delta waves (H left). Right: Cumulative distribution reveals a minimal shift in the peak minus trough slow oscillation amplitude after CNO administration, compared with delta waves (H, right) (two-sample Kolmogorov-Smirnov test). (L) Higher percent change for delta waves in peak minus trough amplitude with CNO, compared to slow oscillations.


