. 2021 Mar 17;10:e63329. doi: 10.7554/eLife.63329

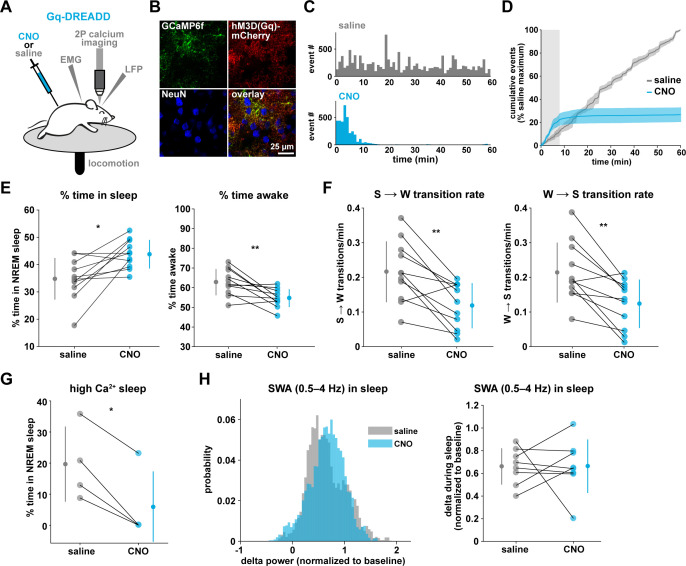
Figure 6. Gq-induced Ca2+ is necessary for sleep-wake transitions.

(A) Experimental setup. Mice were co-injected with GFAP-cyto-GCaMP6f and GFAP-hM3D(Gq)-mCherry AAVs. After I.P. injection of either 1 mg/kg CNO or saline, 2P astrocyte Ca2+ dynamics, LFP, EMG, and locomotion were recorded. (B) Post-experiment immunohistochemistry demonstrates astrocyte-specific expression of the Gq-DREADD (red) and GCaMP6f (green). mCherry+ cells exhibit typical astrocyte morphology and do not co-localize with neurons (blue, NeuN). (C) Representative data from a single Gq-DREADD-expressing animal. Administration of CNO (blue) causes a short initial period of elevated Ca2+ relative to saline administration (gray), followed by a complete suppression of all Ca2+ activity. (D) Cumulative Ca2+ event count after saline (gray) or CNO (blue) injection over 60 min. The initial high Ca2+ period (8 min, light gray box) is followed by suppression of astrocyte Ca2+. (Error bars=SEM, n = 3 mice, 1 hr recordings) (E) Left: The proportion of time mice spend sleeping after CNO administration (during Ca2+ suppression period) is increased relative to saline controls, and time in wake is decreased (right), suggesting Ca2+ suppression is sufficient to increase sleep (for E–F, and H, paired t-test, n = 11 mice; analyses are performed in the 1 hr, 52-min period of Ca2+ suppression). (F) Sleep-to-wake transitions (left) and wake-to-sleep transitions (right) are decreased with CNO relative to saline. (G) During the high Ca2+ period after CNO administration, mice spend less time sleeping compared to saline-injected controls (paired t-test), suggesting the Gq-DREADD-driven Ca2+ increase is sufficient to suppress sleep (n = 4 mice, for E–H, data are represented as mean for each animal and population mean± SD). (H) Distribution of SWA (left) and summary statistics (right) show that despite Ca2+ changes, SWA during sleep is unaffected by Gq-DREADD activation. (n = 8 mice, paired t-test).

Figure 6.

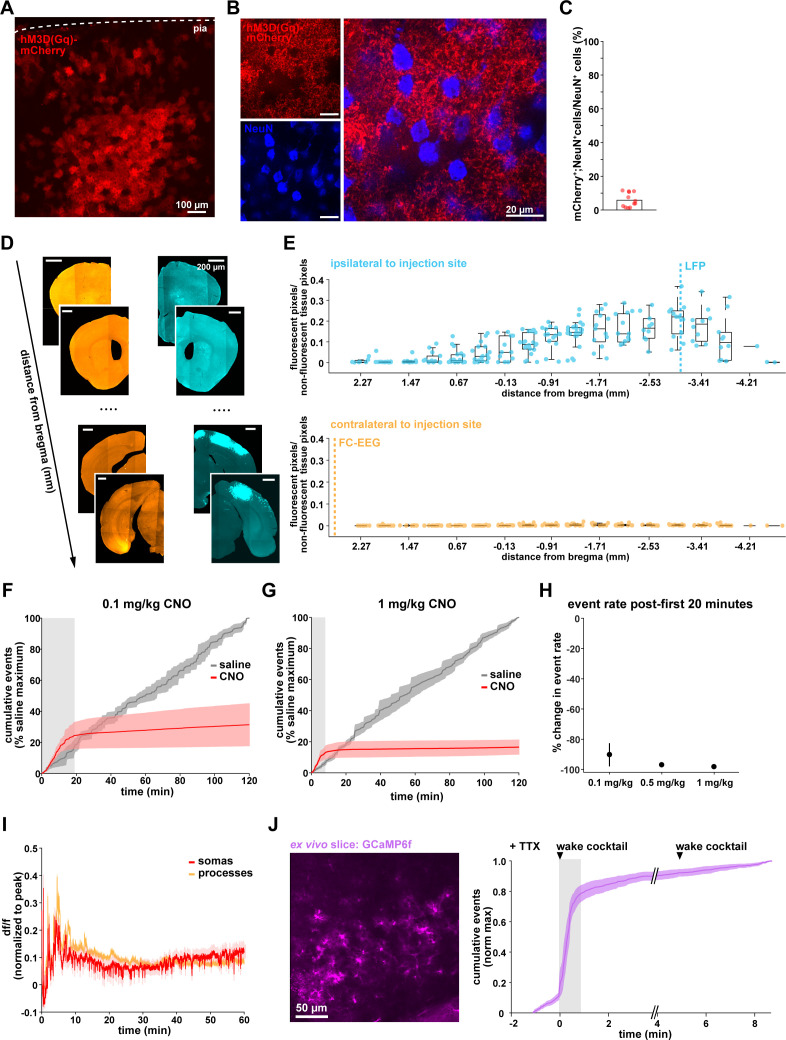
Figure 6—figure supplement 1. Astrocyte-specific expression of Gq-DREADDs across ipsilateral and contralateral cortex.

Figure 6—figure supplement 1.

(A) Representative post-experiment immunohistochemistry demonstrating astrocyte-specific expression of Gq-DREADDs across cortical layers. (B) Representative 63x confocal images of mCherry and NeuN staining to quantify non-specific DREADD expression. (C) Percentage of NeuN+ identified cells that were also mCherry+. (D) Schematic illustrating analysis of cortex-wide Gq-DREADD expression spread in hemispheres both ipsilateral and contralateral to viral injection site. (E) Expression spread in brain slices sampled from rostral to caudal for the ipsilateral (top, cyan) and contralateral hemisphere (bottom, orange) shows that expression is highest in ipsilateral rostral cortex, near the LFP recording site (dashed line, cyan). No expression is detected at the FC-EEG recording site (dashed line, yellow). Viral expression spread for each slice was calculated by normalizing the number of fluorescent pixels to the size of the brain tissue. Data represented with boxplots marking the medians, 25th and 75th percentiles. (F) Cumulative Ca2+ event count for mice after administration of 0.1 mg/kg CNO (red) and saline (gray) showing an initial period of elevated Ca2+ (gray box), followed by a dramatic suppression of Ca2+ events similar to 1 mg/kg CNO (Error bars=SEM, n = 3 mice, 1 hr recordings). (G) Cumulative Ca2+ event count for mice after 1 mg/kg CNO (red) and saline (gray), as shown in Figure 5D (Error bars=SEM, n = 3 mice, 1 hr recordings). (H) Total suppression of astrocyte Ca2+ event rate is similar for all three tested doses of CNO (mean± SEM, 0.1 mg/kg: n = 3 mice, 2 hr recordings; 0.5 mg/kg: n = 1 mouse, 2 hr recordings; 1 mg/kg: n = 5 mice, 2 hr recordings). (I) Mean GCaMP6f fluorescence in somata and processes after administration of 1 mg/kg CNO, with both remaining elevated throughout 1 hr recording (Error bars=SEM, n = 3 mice, 1 hr recordings). (J) Left: Representative 2P image of V1 cortical astrocytes in an acute, ex vivo slice. Right: Cumulative events across two consecutive 5 min videos demonstrating a large response to the first application of a ‘wake’ cocktail (black triangles), but not the second (error bars=SEM, n = 2 mice, eight slices).
Figure 6—figure supplement 2. Gq-DREADD activation suppresses sleep-wake transitions by increasing bout length and decreasing bout number.

Figure 6—figure supplement 2.

(A) Left: Mean sleep bout length after CNO administration is increased compared to saline controls, suggesting Ca2+ dynamics are necessary for sleep-to-wake transitions. Right: Mean sleep bout number observed after CNO administration is decreased compared to saline controls. For all panels, n = 11 mice. Analyses are performed during the 1 hr, 52 min period when Ca2+ is suppressed, all paired t-tests. (B) Left: Mean wake bout length after CNO administration is increased relative to saline, suggesting Ca2+ dynamics are necessary for wake-to-sleep transitions, similar to sleep-to-wake transitions in (A). Right: Mean number of wake bouts after CNO, and during Ca2+ suppression, is decreased relative to saline.