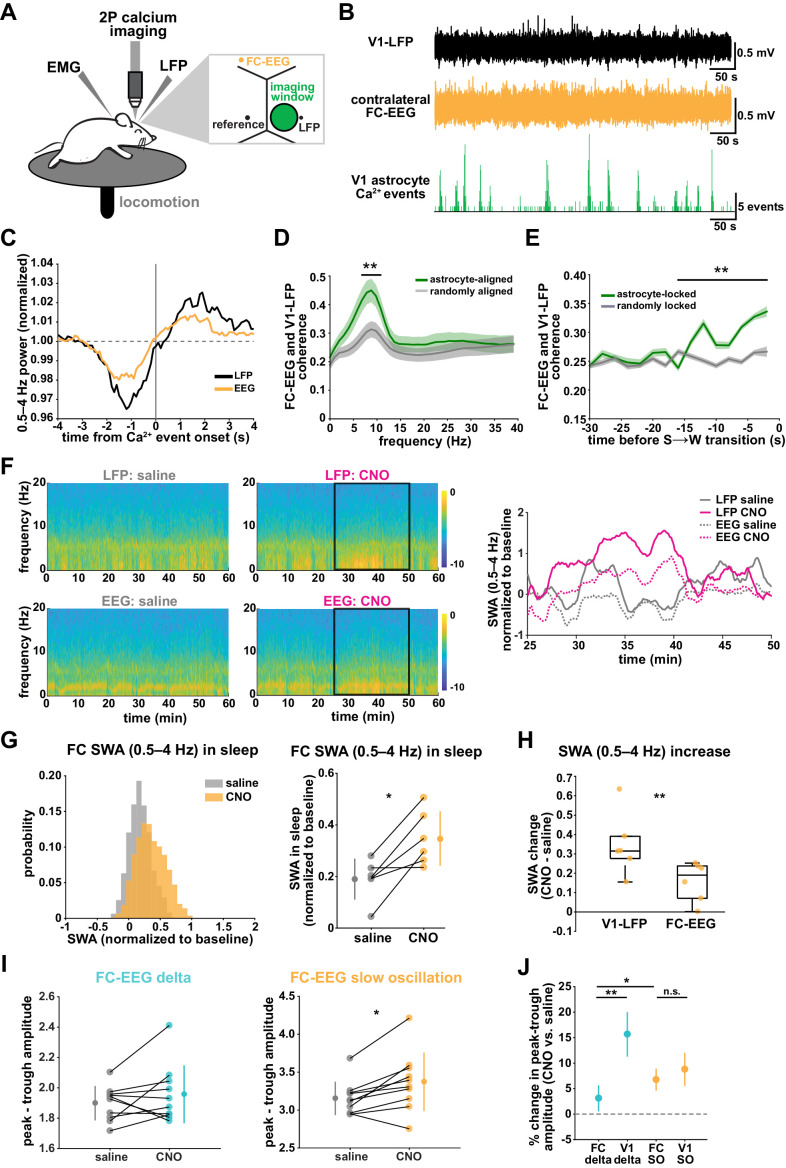
Figure 7. V1 manipulation of astrocyte Ca2+ alters SWA in contralateral frontal cortex via changes in slow oscillations.
(A) Experimental setup. Mice were co-injected with GFAP-cyto-GCaMP6f and GFAP-hM4D(Gi)-mCherry AAVs. 2P astrocyte Ca2+ dynamics in right V1, LFP local to the imaging field, EEG in the contralateral frontal cortex (orange), EMG, and locomotion were recorded. (B) Representative data from simultaneous recordings from V1-LFP (black), contralateral frontal cortex EEG (orange), and V1 astrocyte Ca2+ imaging (green). (C) Average V1-Ca2+ event-triggered traces of FC-EEG SWA (orange) reveal a similar, but smaller, fluctuation of SWA around Ca2+ event onsets compared with V1-LFP (black). (D) Coherence between V1-LFP and FC-EEG is higher after astrocyte event onset (green), compared to randomly sampled time points (gray) (paired t-test, n = 13 mice, median event number/mouse = 7512,512 events). Error bars=SEM. (E) Astrocyte-locked coherence (0–15 Hz) increases before sleep-to-wake transitions (unpaired t-test, n = 13 mice, median event number/mouse = 417 events). (F) Left: Example spectrograms from simultaneously recorded population-level electrophysiology: V1-LFP (top row) and FC-EEG (bottom row) following saline (left column) or CNO (right column) injection. Right: SWA corresponding to the black rectangle marked in the spectrograms demonstrates that CNO (pink) increased SWA in V1-LFP (solid lines) and FC-EEG (dashed lines) compared to saline (gray). (G) Distribution of SWA (left) and summary statistics across mice (right, paired t-test) demonstrate that SWA in FC-EEG is increased after activation of V1 Gi-DREADD-expressing astrocytes by CNO (data represented as mean for each animal and population mean± SD, n = 7 mice, 2 hr recordings). (H) Change in SWA measured by V1-LFP or FC-EEG demonstrate that CNO increases SWA in both measurements, but more in V1-LFP recordings (paired t-test). Data represented using box plots with median, 25th and 75th percentile. (I) Peak-to-trough amplitude for delta waves (cyan, left) and slow oscillations (yellow, right) in saline (gray) and CNO conditions in FC (paired t-test). (J) Percent change in peak-trough amplitude for delta waves (cyan) and slow oscillations (yellow) in CNO vs. saline (paired t-test, data represented as mean± SEM). There is a greater change in amplitude for slow oscillations than delta waves in FC after Gi-DREADD activation in V1.

