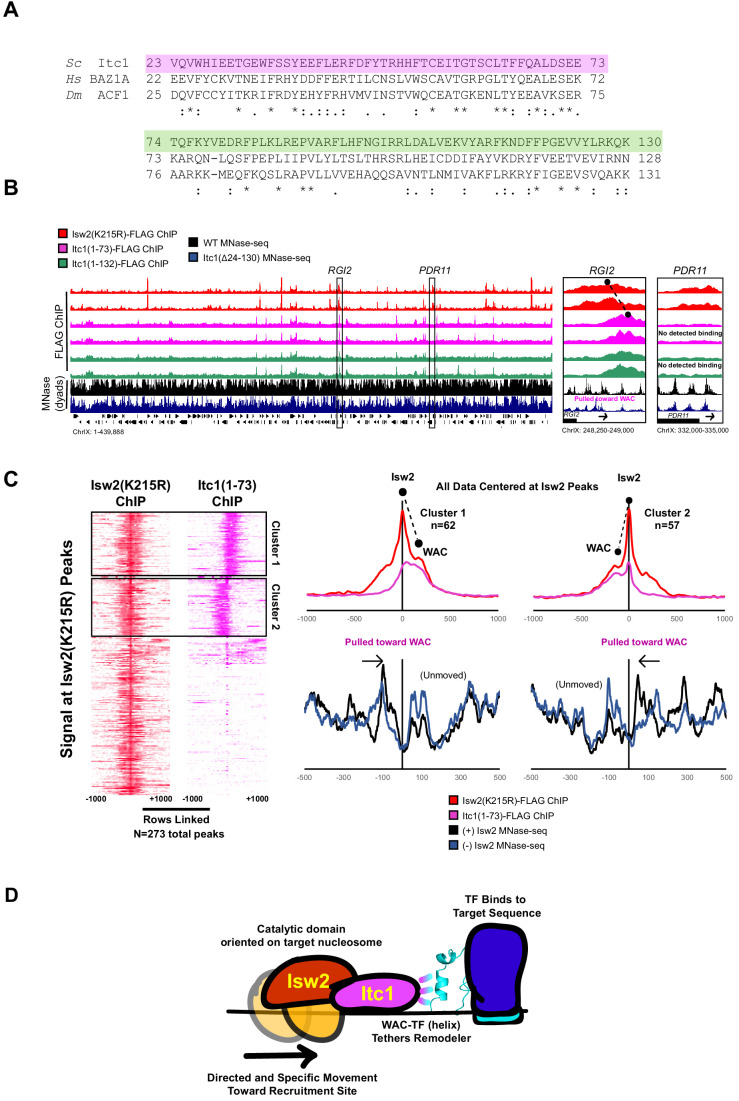
Figure 5. The Itc1 WAC domain associates with genomic Isw2 targets and orients Isw2 on the proper nucleosomes.
(A) Sequence conservation for regions of Itc1 examined by ChIP. Itc1(1–73)-FLAG incorporates the pink highlighted region while Itc1(1–132)-FLAG incorporates the pink and green highlighted regions. Sequence conservation is shown relative to human BAZ1A and Drosophila melanogaster Acf1, two widely studied Itc1 orthologs. (B) (Left) Full view of yeast chromosome IX showing Isw2(K215R)-FLAG ChIP (red), Itc1(1–73)-FLAG ChIP (pink), Itc1(1–132)-FLAG ChIP (green), nucleosome dyad signal from wild-type (WT) yeast (black), and nucleosome dyad signal from Itc1(∆24–130) yeast (blue). Regions indicated by black rectangles are shown with higher resolution on the right. (Right) Zoomed-in view of a locus where Isw2-ChIP and Itc1 truncation ChIP overlap (RGI2) or where only Isw2 binding is detected (PDR11). Black circles indicate center of ChIP peaks and are connected by a dashed black line to highlight offset of indicated peaks. (C) (Left) Heatmap showing 273 detected Isw2 ChIP peaks (red) clustered by associated Itc1(1–73)-FLAG ChIP (pink). The two clusters (right-side Itc1 and left-side Itc1) are shown on the right. (Right) Meta-analysis of Isw2(K215R)-FLAG ChIP signal at 62 cluster 1 peaks or 57 cluster 2 peaks (from left) with associated Itc1(1–73)-FLAG signal. The offset between Isw2 and Itc1 is indicated by two circles connected by a dashed line. Associated nucleosome positions for WT and isw2 deletion strains for each cluster are shown below in black and blue, respectively. All data are centered at called Isw2 peaks. (D) Cartoon representation for how the N-terminal WAC domain of Itc1 interacts with a helical element in a sequence-specific DNA-associated transcription factor to orient Isw2 on the proper motif-proximal nucleosome for directional movement toward the recruitment site.


