. 2021 Mar 2;10:e64252. doi: 10.7554/eLife.64252

Figure 3. RNAs predicted to have large disordered regions have a high propensity to induce network formation in vitro.

(A) Distribution of length of sphere- and network-forming RNAs. Mann–Whitney test, Z = −2.76, p=0.004. See also Figure 3—source data 1. (B) Number of AU-rich elements in sphere- and network-forming RNAs with a length shorter than 2000 nt. See also Figure 3—source data 1. Mann–Whitney test, Z = 0.190, p=0.258, NS, not significant. (C) Distribution of GC-content of sphere- and network-forming RNAs with a length shorter than 2000 nt. See also Figure 3—source data 1. Mann–Whitney test, Z = 0.566, p=0.605. (D) Centroid RNA secondary structure of TLR8 3′UTR predicted by RNAfold. The color code represents base-pairing probability. (E) Same as (D), but the TNFSF11 3′UTR is shown. (F) Normalized ensemble diversity (NED) values of sphere- and network-forming RNAs. See Figure 3—source data 1. Mann–Whitney test, Z = −3.3, ***p<0.0003. (G) Experimental validation of N = 24 in vitro transcribed RNAs whose ability for network formation was predicted by NED. Sphere formation is indicated in dark gray, whereas network formation is indicated in light gray. See Figure 3—source data 1. Mann–Whitney test was performed on the experimental validation, Z = −2.8, ***p=0.004. (H) Same as (D), but the mutant TNFSF11 3′UTR is shown. (I) Representative confocal images of phase separation experiments using purified mGFP-FUS-TIS (10 µM) in the presence of 150 nM of the indicated in vitro transcribed RNAs after 16 hr of incubation. Scale bar, 2 µm.

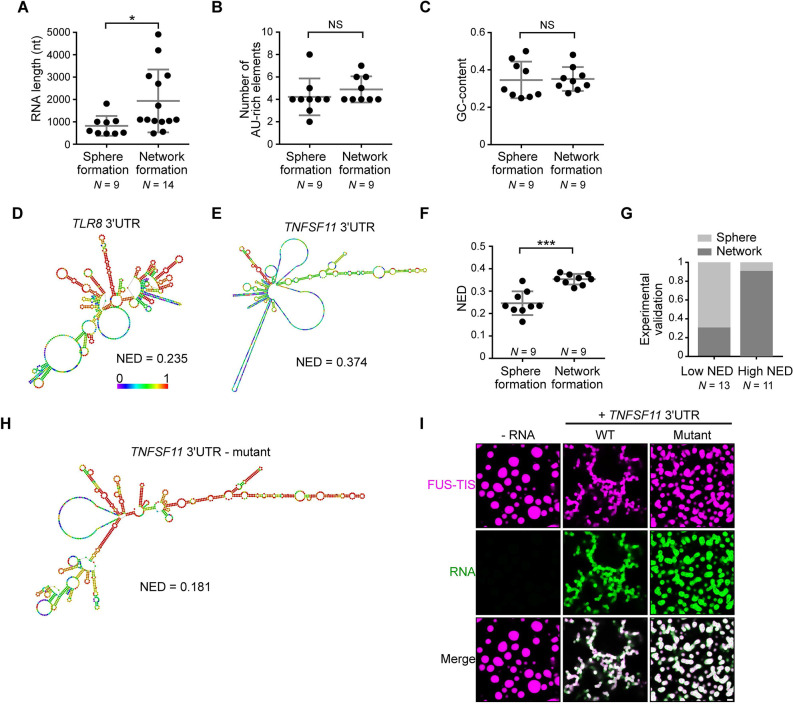
Figure 3—source data 1. Length, number of AU-rich elements, GC-content, and normalized ensemble diversity values of the 47 experimentally tested 3′UTRs.

Figure 3.

Figure 3—figure supplement 1. Specific RNAs with various lengths induce mesh-like condensates in vitro.

Figure 3—figure supplement 1.

Representative confocal images of phase separation experiments using purified mGFP-FUS-TIS (10 µM) in the absence or presence of the indicated in vitro transcribed RNAs after 16 hr of incubation. Scale bar, 2 µm. (A) RNAs with a length of approximately 3000 nt are shown. (B) RNAs with a length between 1500 and 2000 nt are shown. (C) RNAs with a length of approximately 1000 nt are shown.
Figure 3—figure supplement 2. RNA alone does not induce phase separation in vitro.

Figure 3—figure supplement 2.

Representative confocal images of phase separation experiments using purified mGFP-FUS-TIS (10 µM) in the absence or presence of the indicated in vitro transcribed RNAs after 16 hr of incubation. Scale bar, 2 µm. (A) RNAs with a length of approximately 500 nt are shown. (B) Representative confocal images of Cy5-labeled RNAs at the indicated concentrations. Scale bar, 5 µm.
Figure 3—figure supplement 3. Predicted RNA secondary structures and their corresponding normalized ensemble diversity values for examples of sphere-forming, network-forming, and highly structured RNAs.

Figure 3—figure supplement 3.

(AB) Centroid RNA secondary structure of two sphere-forming 3′UTRs predicted by RNAfold. The color code represents base-pairing probability. See also the URLs in Figure 3—source data 1. (CD) As in (A), but centroid RNA secondary structure of two network-forming 3′UTRs predicted by RNAfold. (E) As in (A), but sequence and centroid RNA secondary structure of a tRNA is shown. (F) As in (A), but sequence and centroid RNA secondary structure of six MS2-binding sites is shown.
Figure 3—figure supplement 4. The normalized ensemble diversity (NED) value of RNAs is highly predictive for their ability to form sphere- or mesh-like condensates.

Figure 3—figure supplement 4.

(A) Totally 10 out of 11 RNAs with a high NED value were predicted correctly to induce network formation. Representative confocal images of phase separation experiments using purified mGFP-FUS-TIS (10 µM) in the absence or presence of the indicated in vitro transcribed RNAs after 16 hr of incubation. Scale bar, 2 µm. The length of all RNAs is approximately 1000 nt. The minimum concentration for induction of network formation varies. The GLYATL3 3′UTR is unable to induce network formation even at high concentrations. (B) Totally 9 out of 13 RNAs with a low NED value were predicted correctly to induce sphere-like condensate formation. As in (A).
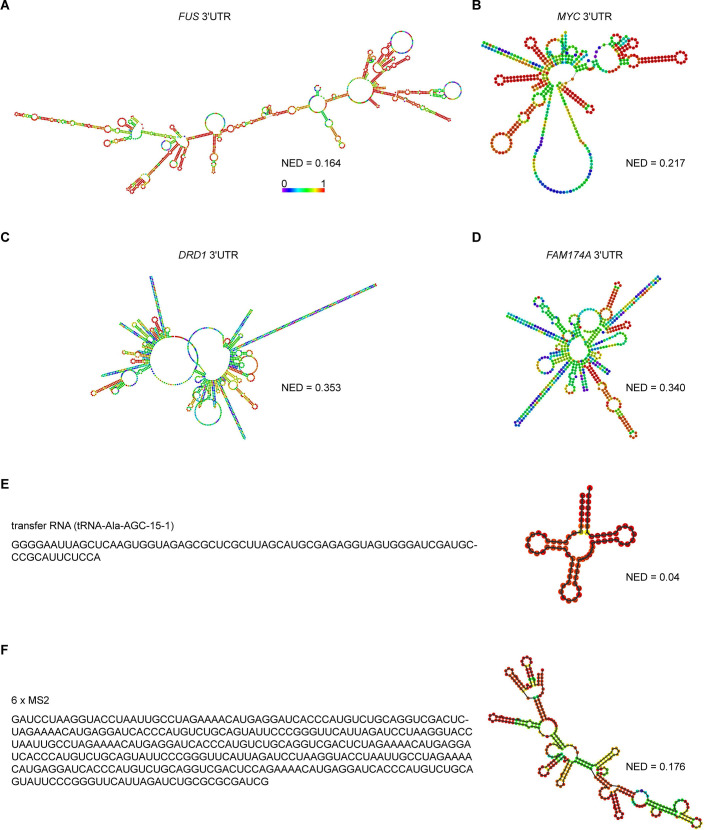
Figure 3—figure supplement 5. In a size-restricted dataset, the number of AU-rich elements does not predict mesh-like condensate formation.

Figure 3—figure supplement 5.

(A) Number of AU-rich elements in RNAs with high normalized ensemble diversity (NED) or low NED values. See also Figure 3—source data 1. Mann–Whitney test, NS, not significant. (B) Nucleotide sequence of the TNFSF11 3′UTR mutant. Two 15-nt oligonucleotides (red and magenta bars) that are complementary to upstream sequences (red and magenta fonts) were added into the TNFSF11 3′UTR. This reduces the unstructured regions and increases the local secondary structure.