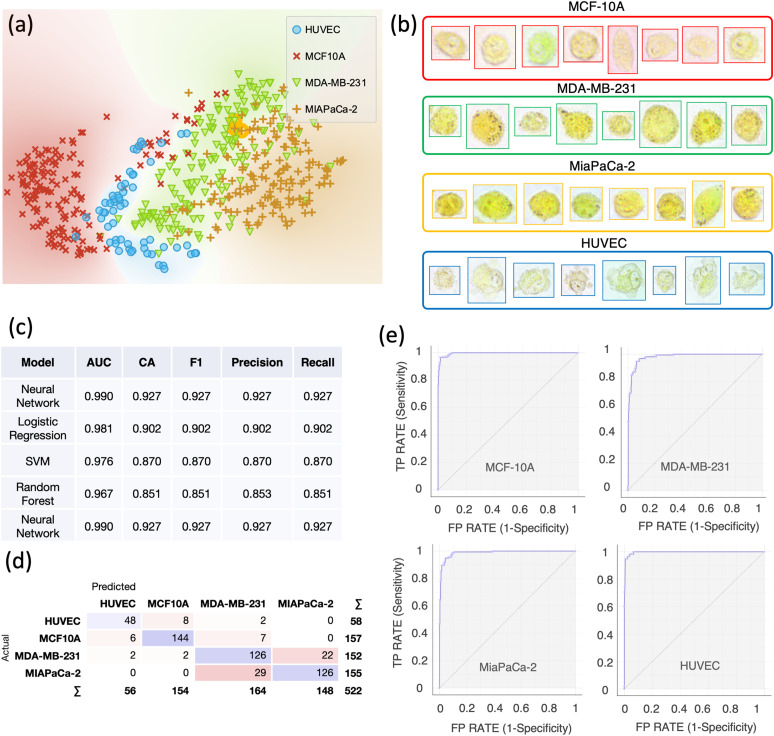
FIG. 4.
Single-cell computational classification of four cell lines: MCF-10A, MDA-MB-231, and MiaPaCa-2 and HUVEC. (a) The t-SNE plot of four cell lines. (b) Examples of color bright-field images of individual MCF-10A, MDA-MB-231, MiaPaCa-2, and HUVEC cells. Cells are imaged just after incubation with BTB using a 40× objective. (c) Evaluation results of the modeling using 10-fold cross-validation. AUC = Area Under the Curve; CA = classification accuracy. The table is sorted based on scoring values of CA and precision. (d) Confusion matrix of the neural network model, which best scored in the classification. (e) Receiver operating characteristic ROC curves for each cell line using the neural network model. The size of each sample is N = 157 for MCF-10A, N = 152 for MDA-MB-231, N = 155 for MiaPaCa-2, and N = 58 for HUVECs.

