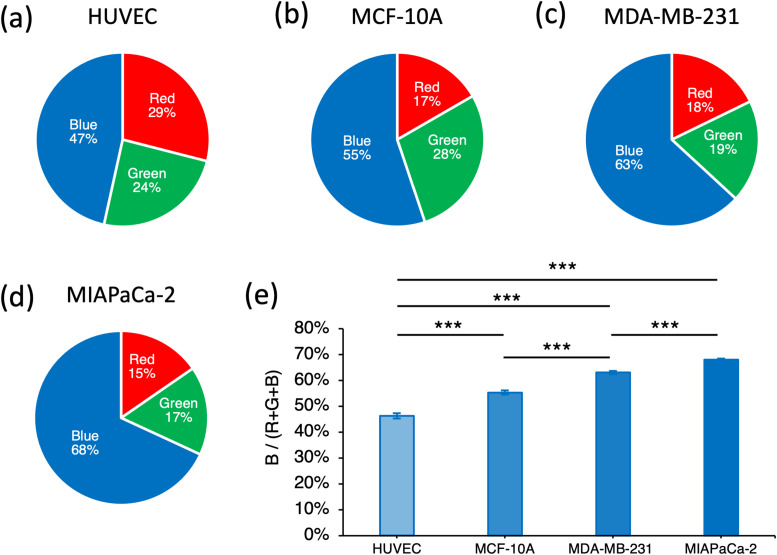
FIG. 5.
RGB analysis. The pie charts show the Red/Green/Blue components of the single-cell images for the following cell lines: (a) HUVEC, (b) MCF-10A, (c) MDA-MB-231, and (d) MiaPaCa-2. (e) Quantification of the blue signal with respect to the total intensity signal (Red + Green + Blue) for each cell lines. The histogram shows the average of the median intensity values of the blue signal calculated across each cell. Error bars represent 95% confidence interval. Paired samples t-tests are performed. ***p < 0.001.

