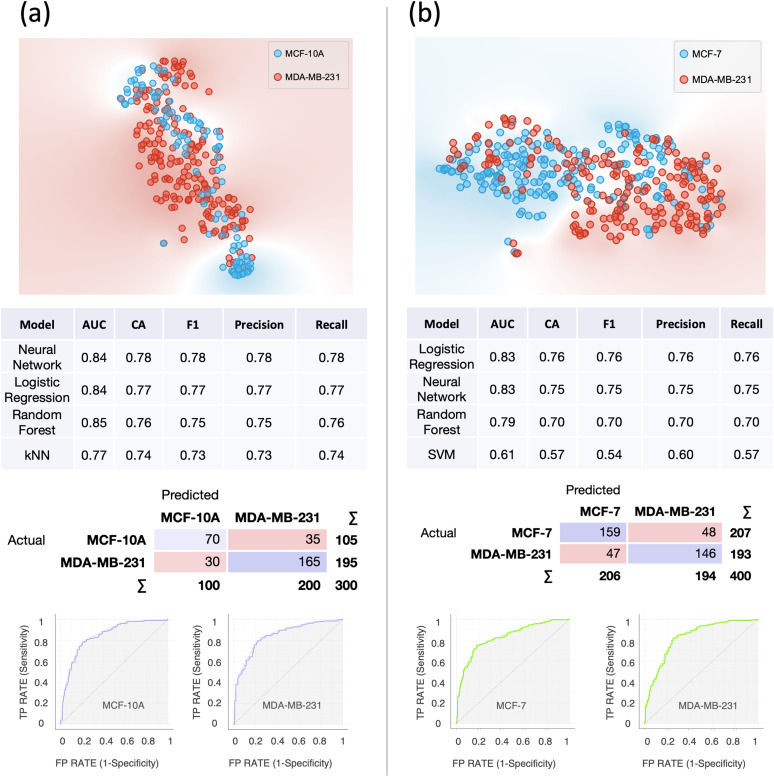
FIG. 6.
Single-cell computational classification in the case of co-cultures. (a) Results of the computational classification between MCF-10A (N = 136) and MDA-MB-231 (N = 164). (b) Results of the computational classification between MCF-7 (N = 117) and MDA-MB-231 (N = 283). In both cases, at the top, the t-SNE plots are shown; in the middle, the evaluation results of the modeling using 10-fold cross-validation and confusion matrices for the best scoring models are shown. AUC = Area Under the Curve; CA = classification accuracy. Below, the ROC curves for each cell line relative to the best scoring models are shown.

