
FIGURE 2.
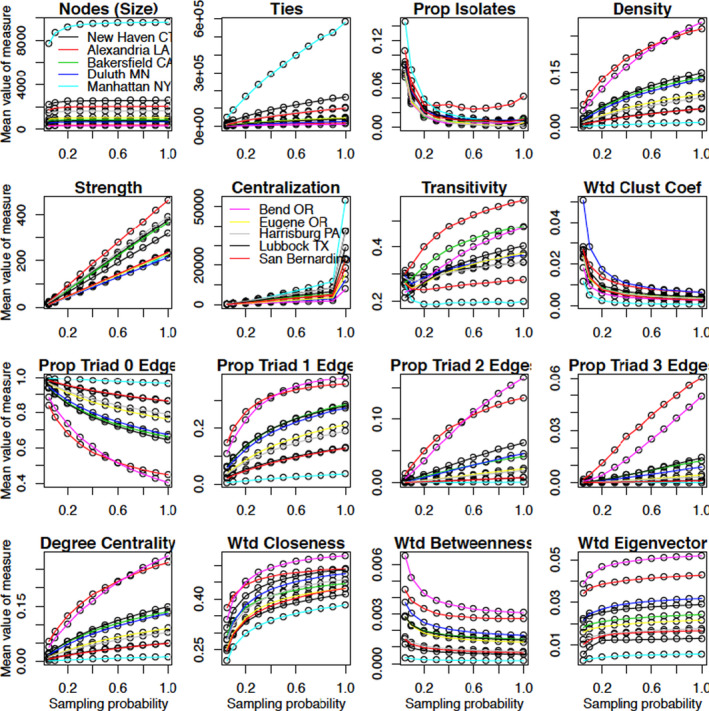
Values of network measures for the 10 health referral regions (HRRs). Clustering coefficient and closeness, betweenness, and eigenvector centrality are all evaluated on the weighted network, whereas the other measures are for the binarized version of the network. Notable HRRs for their extremity are colored as follows: Manhattan (NY) = light blue, Bend (OR) = pink, San Bernardino (CA) = orange [Color figure can be viewed at wileyonlinelibrary.com]