
FIGURE 3.
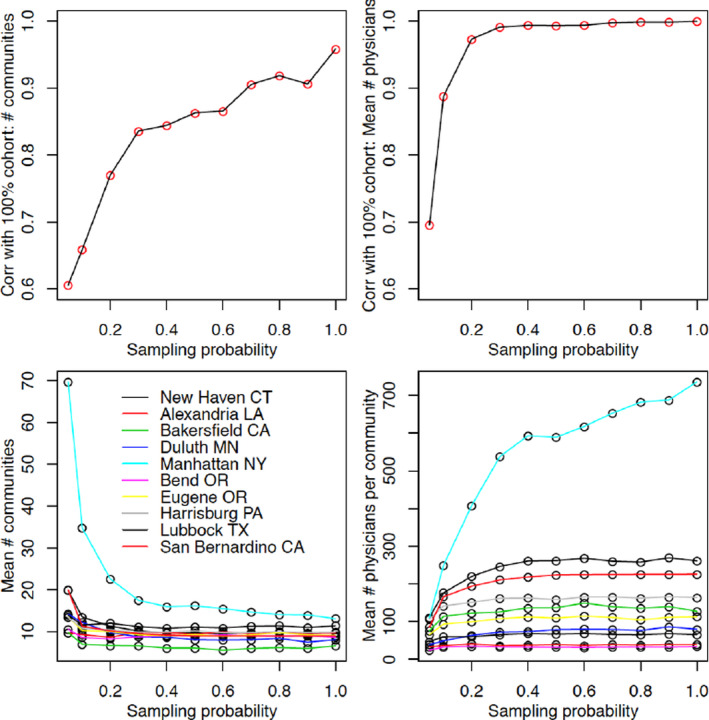
Plots of the Pearson correlation coefficient of the number and the mean size of the communities detected in the network evaluated on a 100 π% sample of patients and the corresponding measures evaluated on the 100% cohort (upper plots). In addition, the number of communities and the mean number of physicians per community are presented for the 10 HRRs (lower plots). Values at do not exactly emulate those of the full network due to the nonoptimality of the community detection algorithm [Color figure can be viewed at wileyonlinelibrary.com]