Figure.

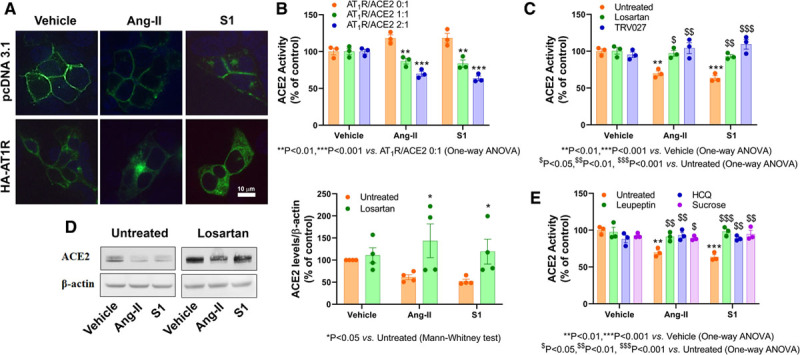
The effects of Ang II (angiotensin II) and S1 spike protein (S1) on ACE2 (angiotensin-converting enzyme 2) in HEK293T cells. A, Subcellular localization of ACE2 (green) in HEK293T cells cotransfected with 0.5 μg GFP (green fluorescent protein)-tagged ACE2 and 1 μg pcDNA3.1 (control vector, top) or HA-tagged AT1R (angiotensin type 1 receptor; bottom) after vehicle (left), Ang II (1 μmol/L, middle) or S1 (30 ng/mL, right) treatment for 4 h. B, ACE2 activity in HEK293T cells cotransfected with GFP-tagged ACE2 (0.5 μg) and HA-tagged AT1R (0, 0.5, and 1 μg). The total transfected cDNA was kept at 1.5 μg by addition of necessary amounts of pcDNA3.1. ACE2 activity was determined in vehicle-treated cells or after 4 h (corresponding to maximal effect on enzyme activity) treatment with Ang II (1 μmol/L) or S1 (30 ng/mL). C, Pretreatment (30 min) with the AT1R antagonist losartan (1 μmol/L,) or β-arrestin biased agonist TRV027 (100 nmol/L) blocked Ang II– or S1-mediated reduction of ACE2 activity in HEK293T cells transfected with 0.5 μg GFP-ACE2 and 1 μg AT1R. D, Effects of treatment for 18 h (corresponding to maximal effect on protein levels) with Ang II (1 μmol/L) or S1 (30 ng/mL) on total ACE2 cellular levels determined by Western blotting. E, Pretreatment (30 min each) with losartan (1 μmol/L), HCQ (hydroxychloroquine; 100 μmol/L) or sucrose (100 mmol/L) blocks the decrease of ACE2 activity induced by Ang II (1 μmol/L) or S1 (30 ng/mL). The data are presented as mean ±SEM with n=3–4 from at least 3 independent transfections. The experiments were performed as described previously5 (https://www.ncbi.nlm.nih.gov/pmc/articles/PMC7456754/).
