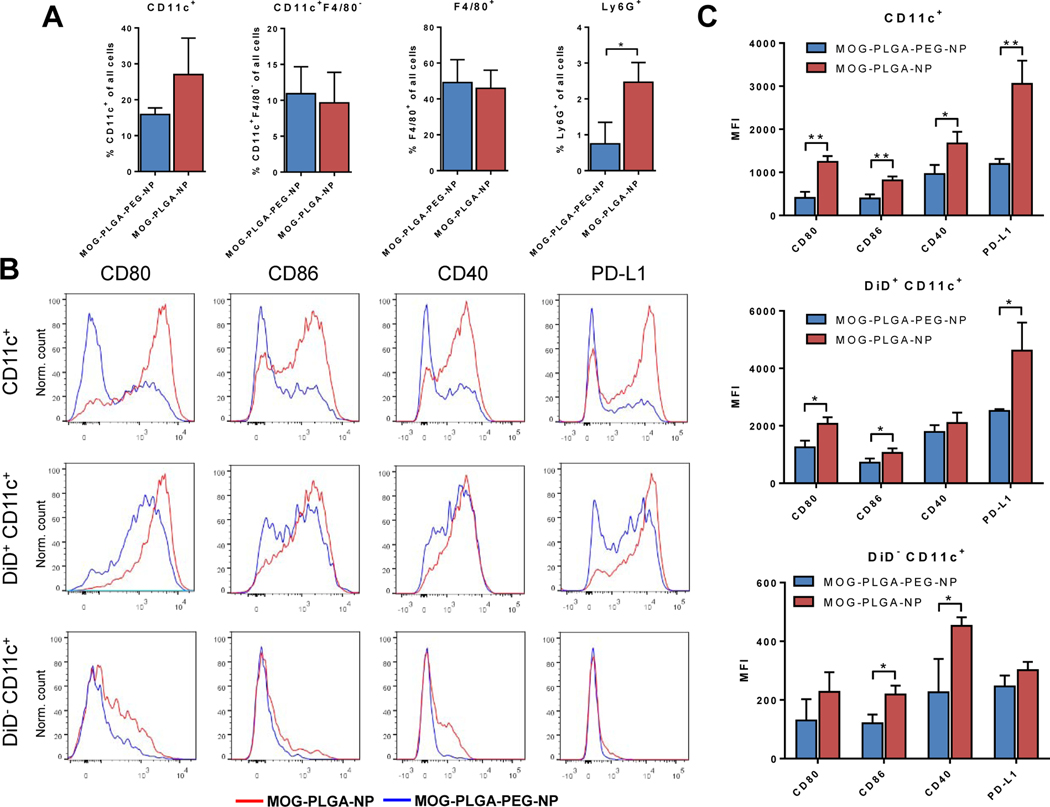
Fig. 4.
Local cell recruitment and activation 2 days after s.c. administration of NPs in C57BL/6J mice. (A) Percentage of CD11c+, CD11c+ F4/80-, F4/80+, and Ly6G+ cells surrounding the local NP injection site. (B) Representative flow cytometry histograms of CD80, CD86, CD40, and PD-L1 expression in DCs with and without NP internalization. (C) Mean fluorescence intensity (MFI) of surface markers in each cell population. All data are represented as mean ± S.D. (n=3). *p<0.05; **p<0.01.

