Fig. 8.
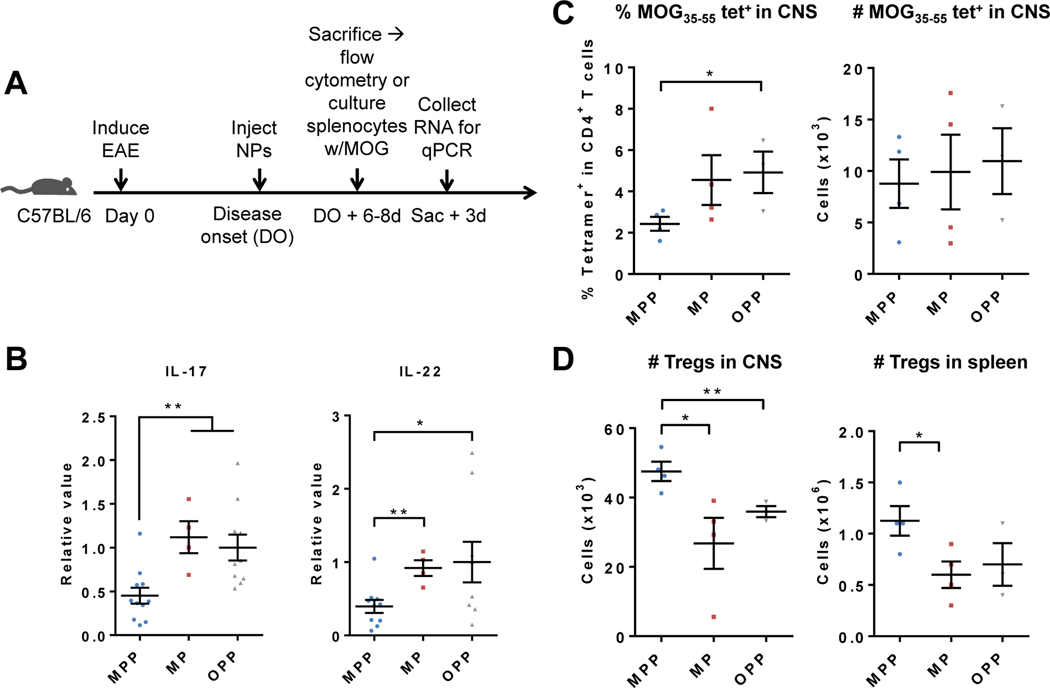
NP-induced tolerance in vivo results in tolerogenic T cell responses. Mice were s.c. injected with MOG-PLGA-PEG-NPs (MPP), MOG-PLGA-NPs (MP), or OVA-PLGA-PEG-NPs (OPP). (A) NPs were injected at the onset of disease. After 6–8 d, CNS and splenocytes were analyzed via flow cytometry or splenocytes were cultured and restimulated with MOG35–55 for 3 days. (B) qRT-PCR analysis of splenocyte IL-17 and IL-22 mRNA 3 after restimulation. (C) Percentage and number of MOG35–55-specific CD4 T cells in the CNS. (D) Number of Tregs in the CNS and spleen. Each data point represents one mouse. Data are represented as mean ± S.E.M. *p<0.05; **p<0.01.

