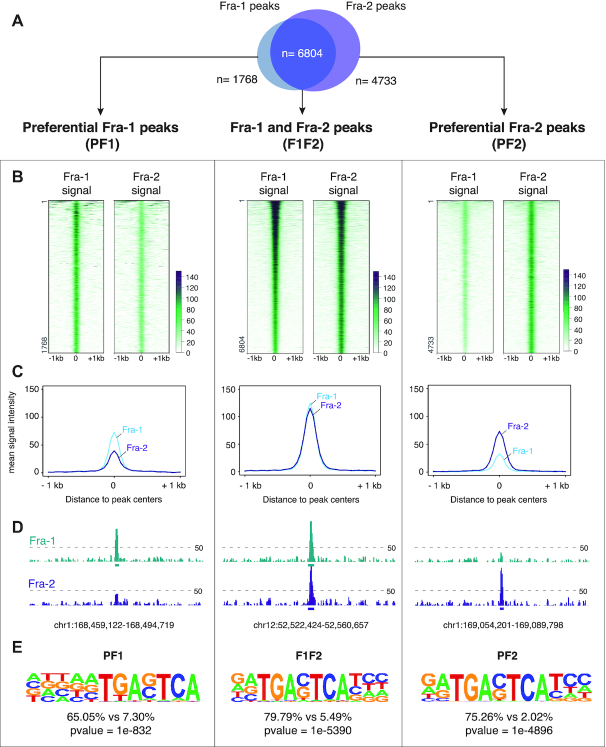
Figure 2.
Fra-1- and Fra-2-binding sites in chromatin of MDA-MB-231 cells. MDA-MB-231 cells were cultured under standard conditions. (A) Overlap between Fra-1 and Fra-2 ChIP-seq peaks. Definitions of PF1, PF2 and F1F2 peaks are given in the text. (B) Heatmap representation of Fra-1 and Fra-2 signals at ±1 kb around PF1, F1F2 and PF2 peak centers. Regions were sorted according to Fra-1 decreasing signal intensity. (C) Fra-1 and Fra-2 metaprofiles at ±1 kb around PF1, F1F2 and PF2 peak centers. (D) Examples of PF1, F1F2 and PF2 peaks. The threshold for peak calling was set to 50 and is indicated by dotted lines (also see text). (E) De novo motif analysis using HOMER. The top-ranked motifs found in PF1, F1F2 and PF2 categories of sites are presented. Percentages indicate the fraction of peaks per group that contain the corresponding motif, as compared to a random set of genomic regions chosen as background.

