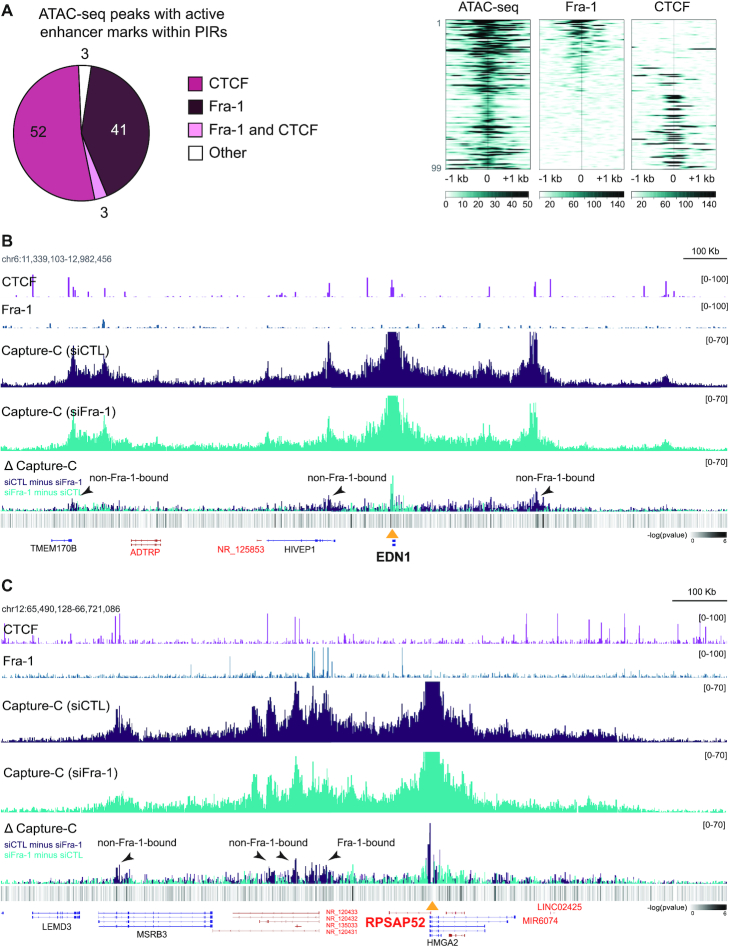
Figure 7.
Limited effect of Fra-1 on overall 3D chromatin structure control at Fra-1-regulated gene loci. (A) Fra-1 and CTCF binding at PIRs with active enhancer marks and ATAC-seq peaks in MDA-MB-231 cells cultured under standard conditions. The left panel shows the distribution of the Fra-1 and CTCF ChIP-seq peaks and the right panel shows their heatmaps at the studied regions. For the heatmaps, the regions were sorted according to Fra-1 decreasing signal intensity. (B and C) Modulation of chromatin interactions by Fra-1 at the EDN1 (B) and RPSAP52 (C) loci. MDA-MB-231 cells were transfected for 72 h using siCTL or siFra-1 before NG Capture-C analysis. ΔCapture-C represents the differences in NG Capture-C signals between Fra-1-proficient (purple) and Fra-1-depleted (blue) conditions. CTCF and Fra-1 ChIP-seq data are presented above NG Capture-C data. DESeq2 analysis of the differential enrichment (minus log10 adjusted P-values) mapped across the loci is shown in the heatmap at the lower panels.

