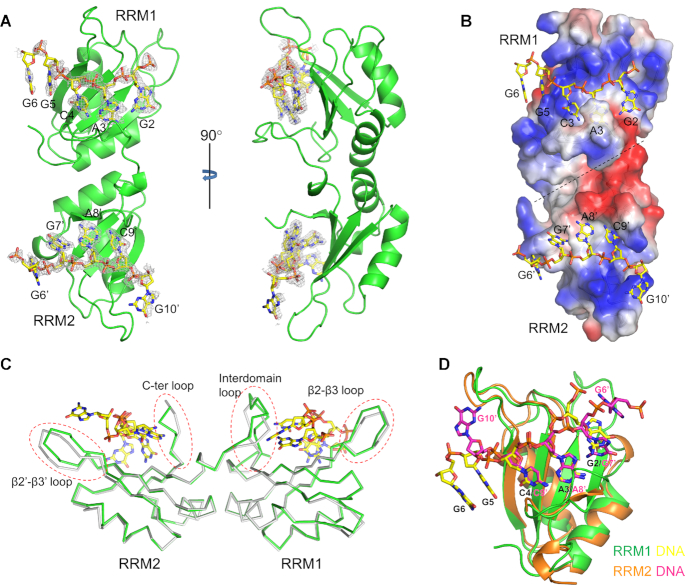
Figure 3.
Structure of RBM45RRM1–2−ssDNA complex. (A) The overall structure of the RBM45RRM1–2−ssDNA complex. RBM45 is shown as green cartoon, the ssDNAs are shown as yellow sticks. The simulated annealing omit map of ssDNA (Fo − Fc contoured at 2.5 σ) are shown as gray meshes. (B) The surface electrostatic potential of RBM45RRM1–2. The ssDNA bind to the positively charged regions. (C) Structural changes of RBM45RRM1–2 by DNA-binding. The RBM45RRM1–2 in complex and apo structures are shown as green and gray ribbons, respectively. The DNA is shown as yellow sticks. The changed regions are enclosed in red dashed circles. (D) Superimposition of RRM1 and RRM2. The RRM1 and RRM2 are shown as green and orange cartoons, respectively. The ssDNA bound RRM1 and RRM2 are shown as yellow and magenta sticks.

