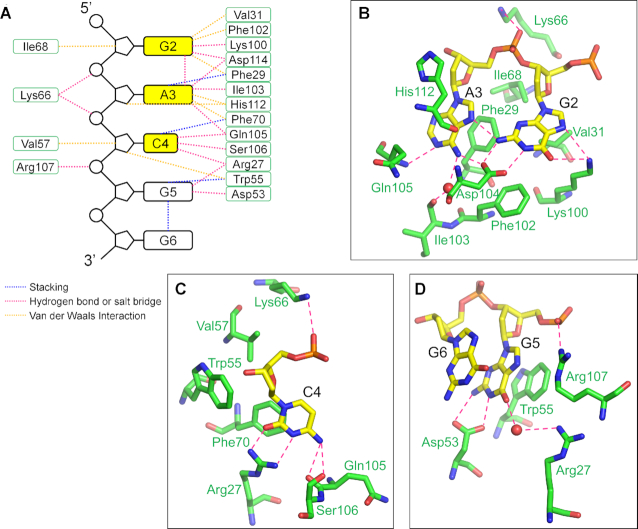
Figure 4.
The interactions between RRM1 and ssDNA. (A) A schematic drawing of RRM1−ssDNA interaction. The DNA bases, deoxyriboses, and phosphates are represented as black boxes, pentagons and circles, respectively. The recognition bases are highlighted in yellow. The amino acid residues are represented as green boxes. The magenta, blue, and orange dashed lines denote hydrogen bonds or salt bridges, stacking and Van der Waals interactions, respectively. (B−D) Detail views of interactions between DNA and RRM1 of RBM45. The involved RBM45 and DNA residues are shown as green and yellow sticks, respectively. The hydrogen bonds and salt bridges are indicated by magenta dashed lines.

