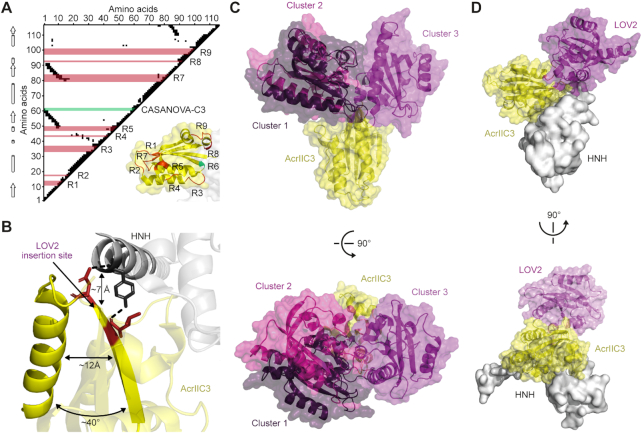
Figure 3.
The LOV2 domain in CN-C3 is located in close proximity to the NmeCas9 binding surface. (A) Analysis of AcrIIC3 residue contacts. Spatially proximate AcrIIC3 residue pairs (distance < 7 Å) are indicated by black squares (triangular plot). α-Helices and β-sheets, indicated by cylinders and arrows according to the published structure (PDB: 6J9N) are shown on the left. Regions into which the LOV2 domain was inserted into AcrIIC3 (see Figure 1B) are indicated in red and correspond to the labelled regions in the AcrIIC3 structure (lower right). The LOV2 insertion site underlying CN-C3(G) is marked in green. Numbers correspond to AcrIIC3 residues. (B) Close-up view on the identified LOV2 insertion site in context of the AcrIIC3:HNH domain complex. The approximate distance between the insertion site on AcrIIC3 and the NmeCas9 HNH domain is indicated. The angle as well as the distance between the secondary structure elements adjacent to the insertion site are shown. Residues in red mediate direct contact to the HNH domain. (C) Computational model of CN-C3 generated by domain assembly simulation. The three most populated conformational clusters of the LOV2 are shown in purple in descending order. (D) Cluster 3 does not sterically clash with the HNH-domain. PDB 6J9N, 2V0W.

