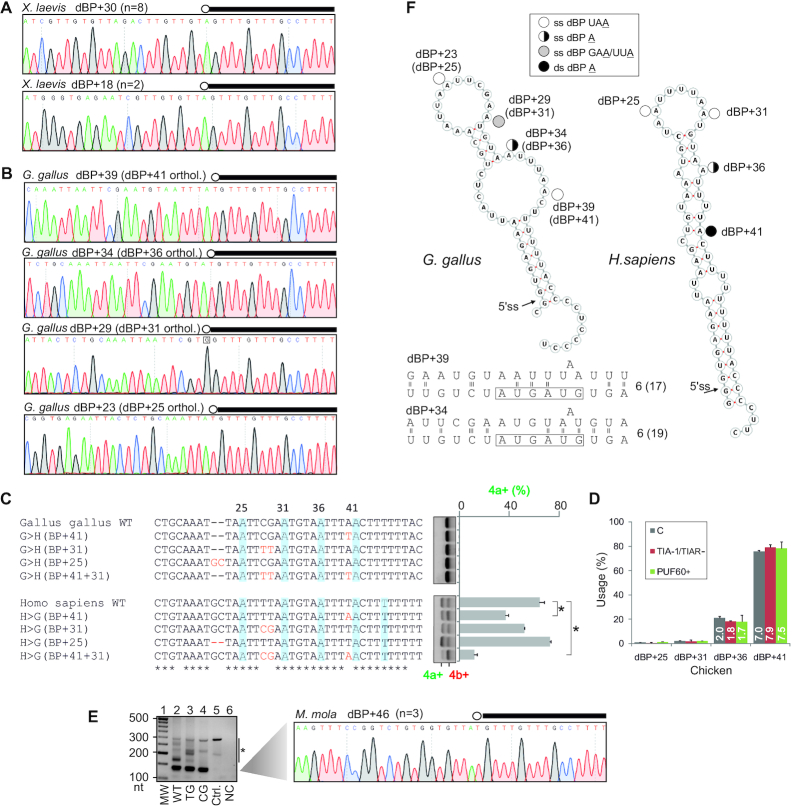
Figure 6.
Evolution of the OgdhdBP cluster in vertebrates. (A, B) BP mapping in frog (A) and chicken (B) transcripts. dBPs are circled and denoted by their distance from the 5′ss. The 5′ end of minigene intron is denoted by black rectangles. (C) The impact of sauropsid dBP variants on exon 4a/4b usage. Mutations introduced in the WT minigenes are in red. dBPs are shaded. Error bars are SDs of two transfections. Asterisks denote significant differences between means (P<0.05; ANOVA with post-hoc Dunnett's tests). (D) Chicken dBP usage in HEK293 cells depleted of TIA-1 or overexpressing PUF60. Bar charts show mean usage of the indicated dBPs; error bars are SDs of two transfection wells. The total number of RNA-seq reads (in millions) is in white. C, untreated cells. (E) BP mapping in ocean sunfish (M. mola) transcripts. RT-PCR gel (left panel) with a 140-nt fragment containing a lariat junction sequenced in the right panel. Ctrl., control plasmid, NC, negative RT control. TG and CG denote M. mola minigenes with mutations removing the AGEZ spoiler and restoring the long AGEZ (Supplementary Figure S13E). Asterisk denotes RT-PCR artefacts confirmed by sequencing. (F) Potential display of dBPs in stable RNA hairpins predicted for chicken (left) and human (right) transcripts. Putative base-pairing interactions between established chicken dBPs and U2 snRNA are at the bottom; for full legend, see Figure 3F. ss, single-stranded; ds, double-stranded.

