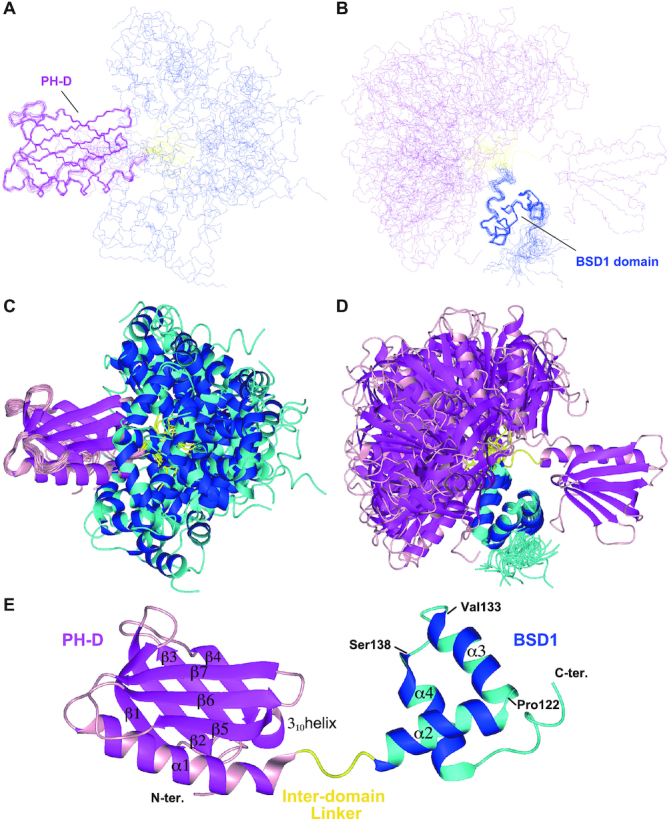
Figure 3.

Solution structure of the PH and BSD1 domains of human TFIIH p62. Overlay of the backbone structures (A, B) and ribbon representation (C, D) of the 20 best structures, superimposed on the PH (A, C) and BSD1 (B, D) domains. (E) Ribbon representation of a single structure. The PH-D is shown in magenta/pink, the BSD1 domain in blue/cyan and the interdomain linker in yellow.
